Kubernetes Monitoring
The Issue trend by Cluster section in the Infrastructure Overview provides a real-time, consolidated view of cluster health and workload stability across your Kubernetes environments.
It brings together cluster-level resource usage, system-level anomalies, workload issues, and network behavior into a single, correlated view, enabling you to assess how each cluster is performing and identify early signs of degradation.
In this guide, we’ll walk through the key components of this view, explain how each section works, and how they can be used to monitor cluster-level performance, detect instability, and accelerate root cause analysis.
Cluster Overview
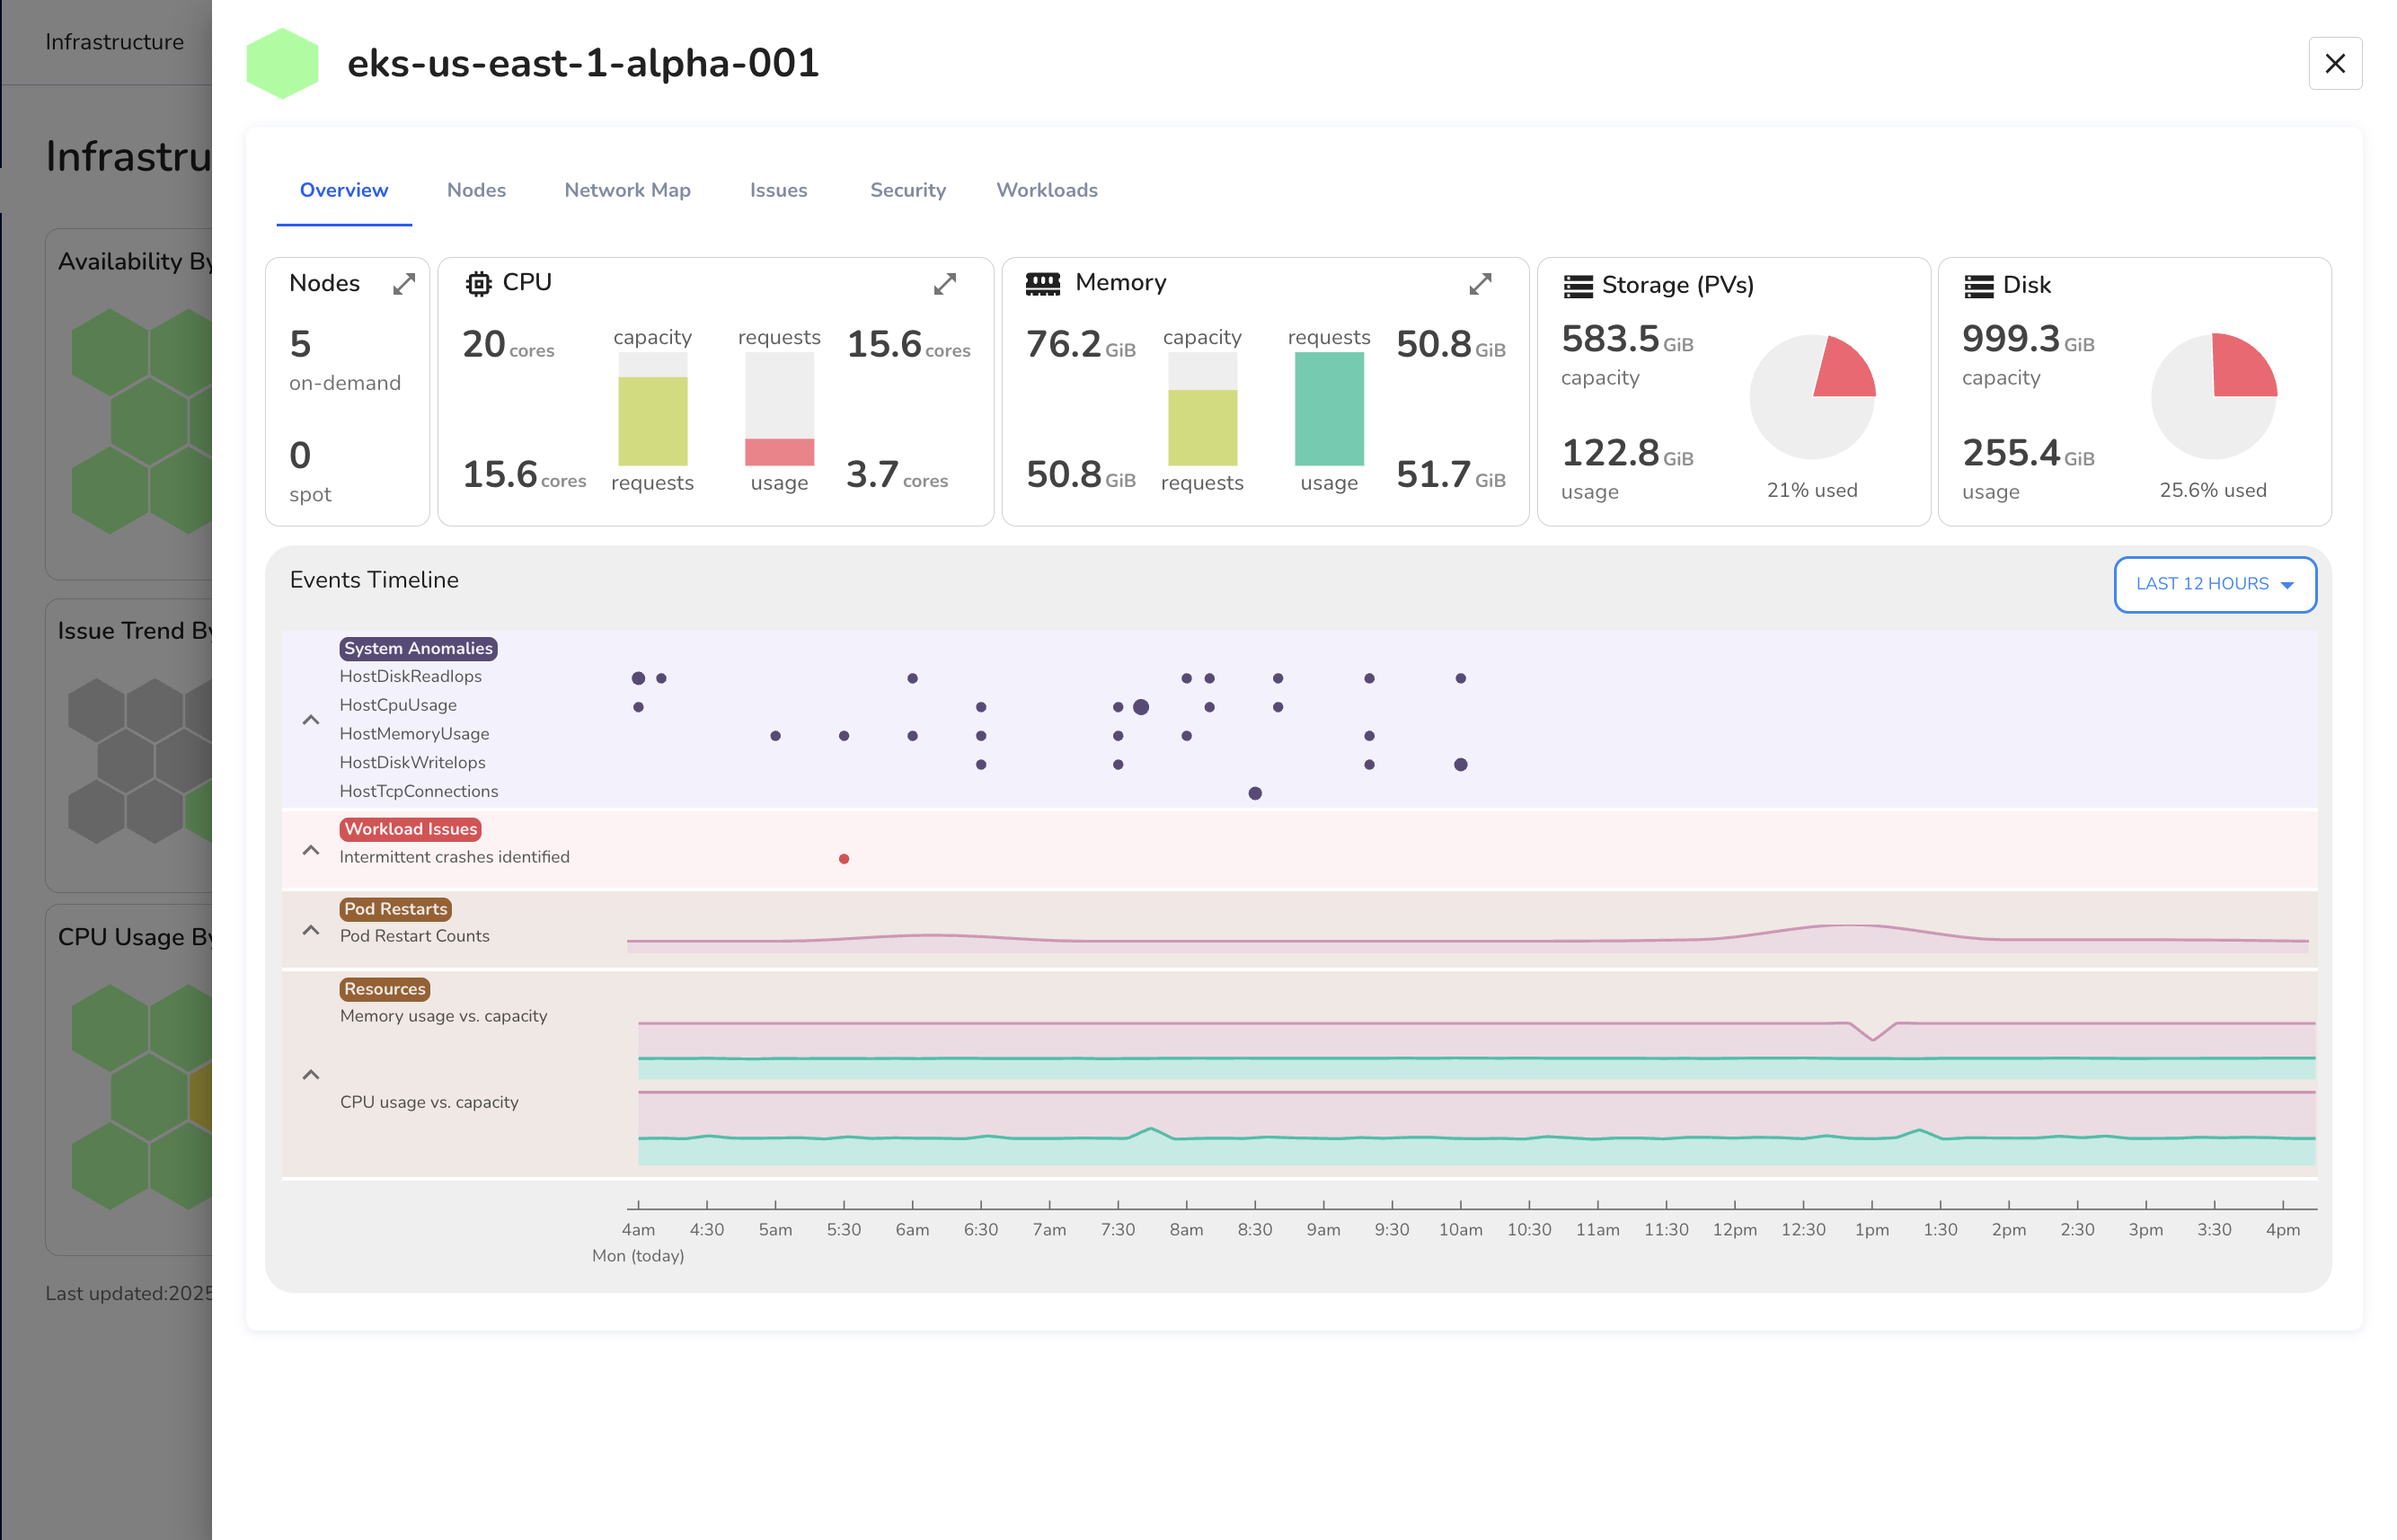
The Overview section provides a real-time snapshot of infrastructure and workload health for a specific Kubernetes cluster.
This view is designed to help engineers quickly assess resource allocation, identify instability, and and correlate infrastructure signals with workload behavior, without switching context.
This view is divided into two parts:
- A top-level summary of key cluster-level metrics
- A time-based Events Timeline for detecting trends and anomalies.
Cluster Summary Panel
The summary panel at the top displays the current state of cluster resources, helping you validate capacity and detect early signs of resource pressure.
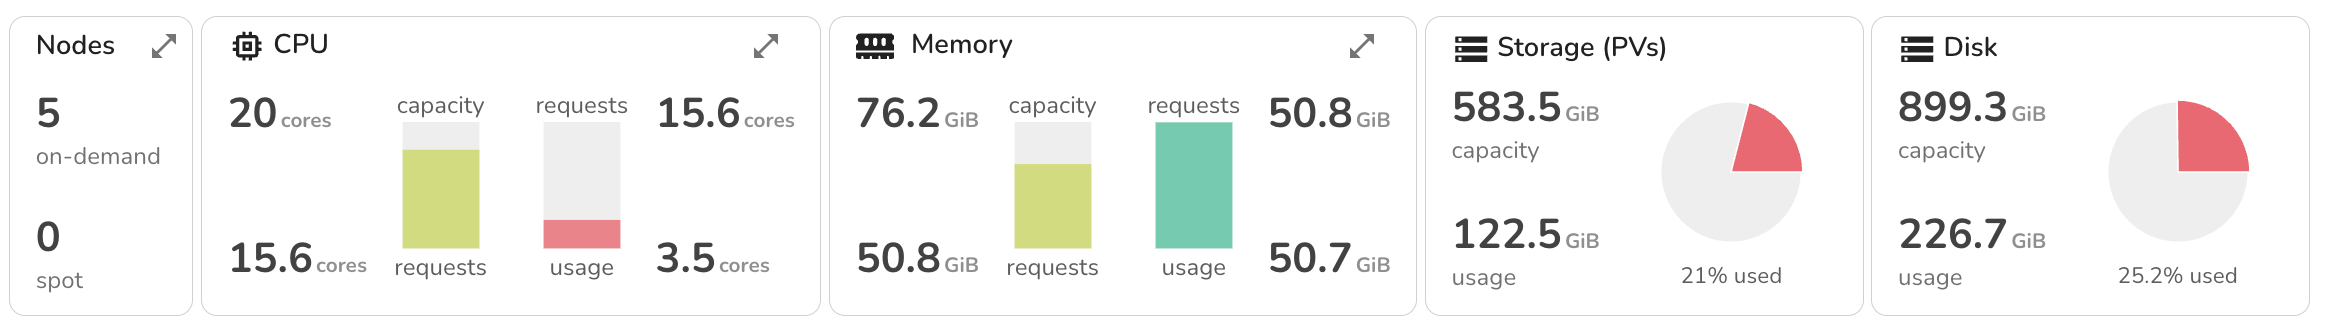
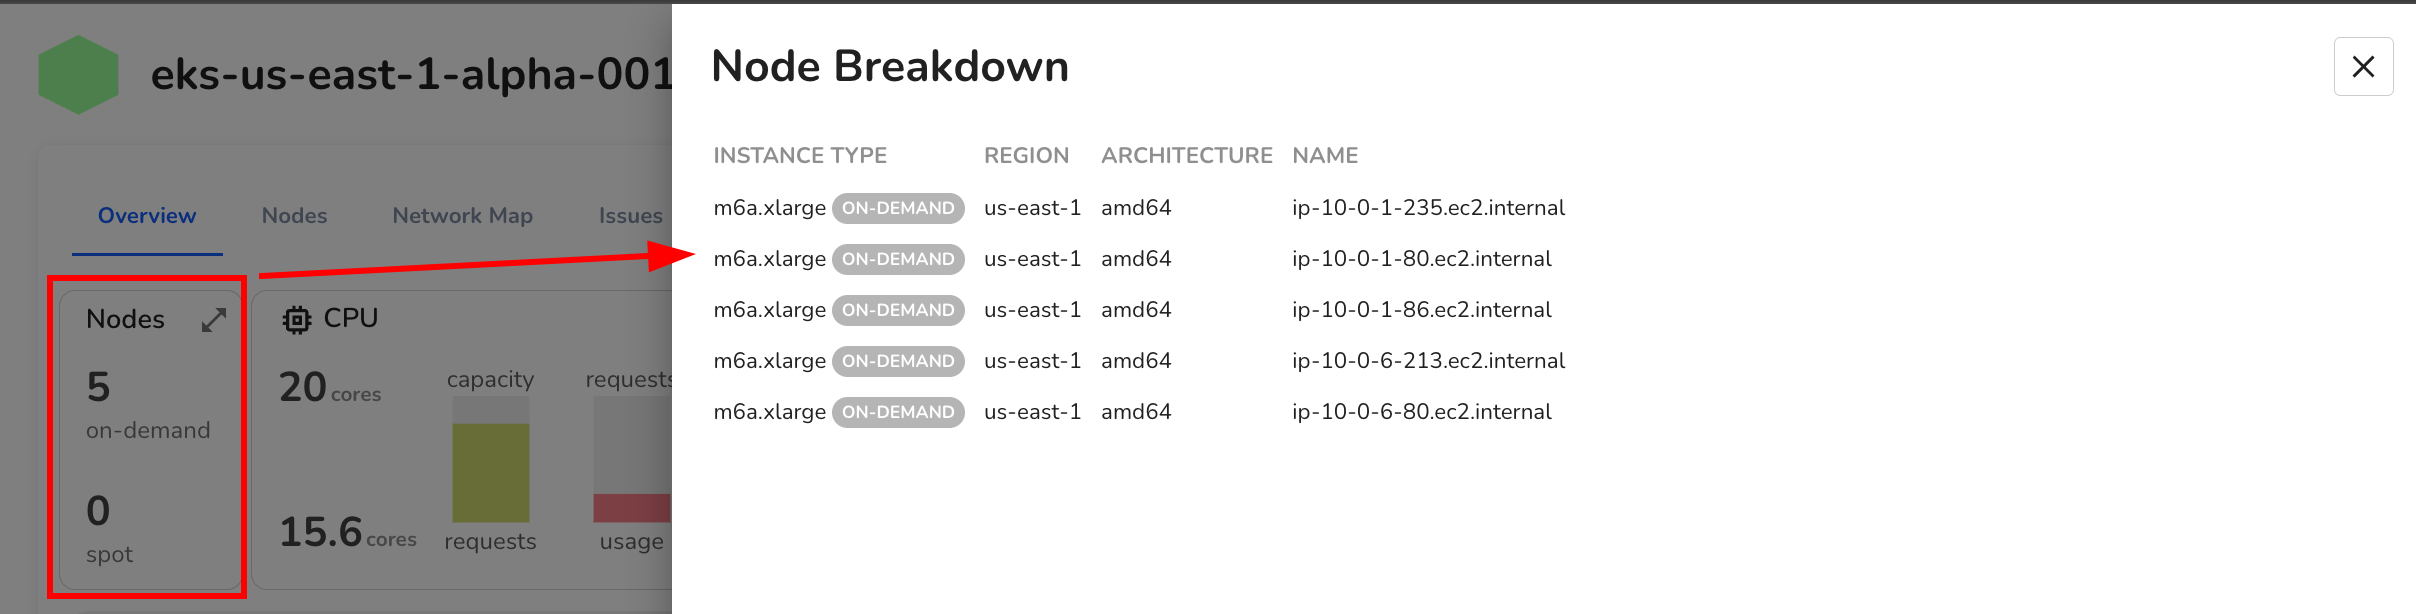
1. Nodes
This section shows the number of nodes provisioned in the cluster, split by on-demand and spot instances.
It provides quick visibility into how your infrastructure is distributed and whether spot capacity is being utilized.
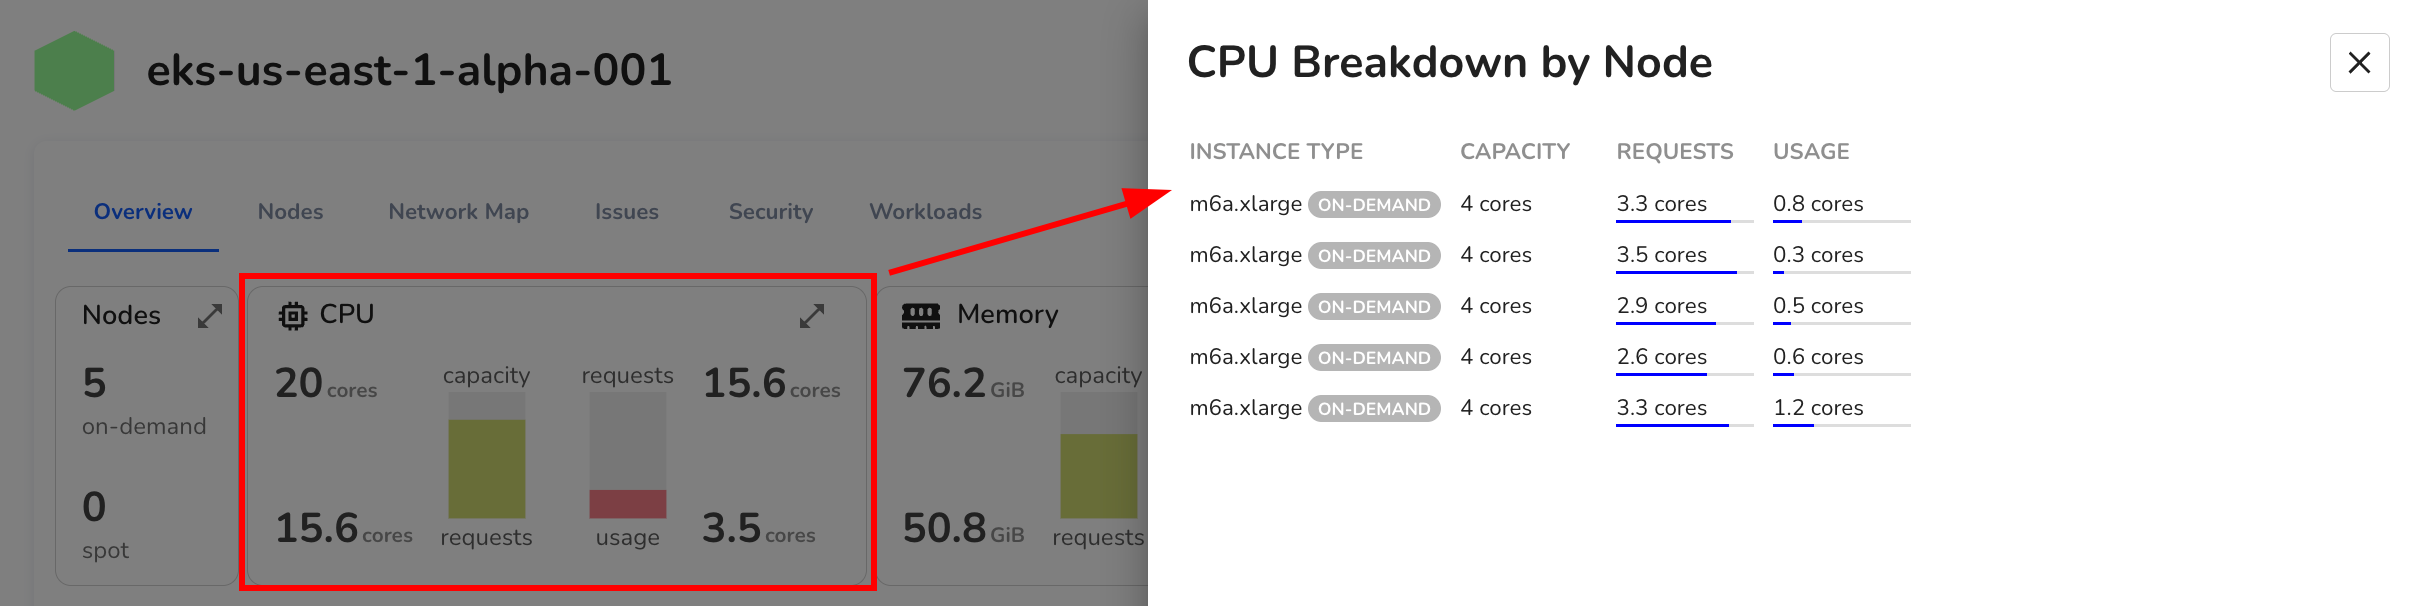
2. CPU
Displays total CPU capacity across the cluster, alongside requested cores and current usage.
Clicking the expand icon opens a detailed per-node CPU breakdown, allowing you to identify underutilized or saturated nodes.
- Capacity represents the total allocatable cores.
- Requests indicate how much CPU is reserved by running workloads.
- Usage reflects actual CPU consumption.
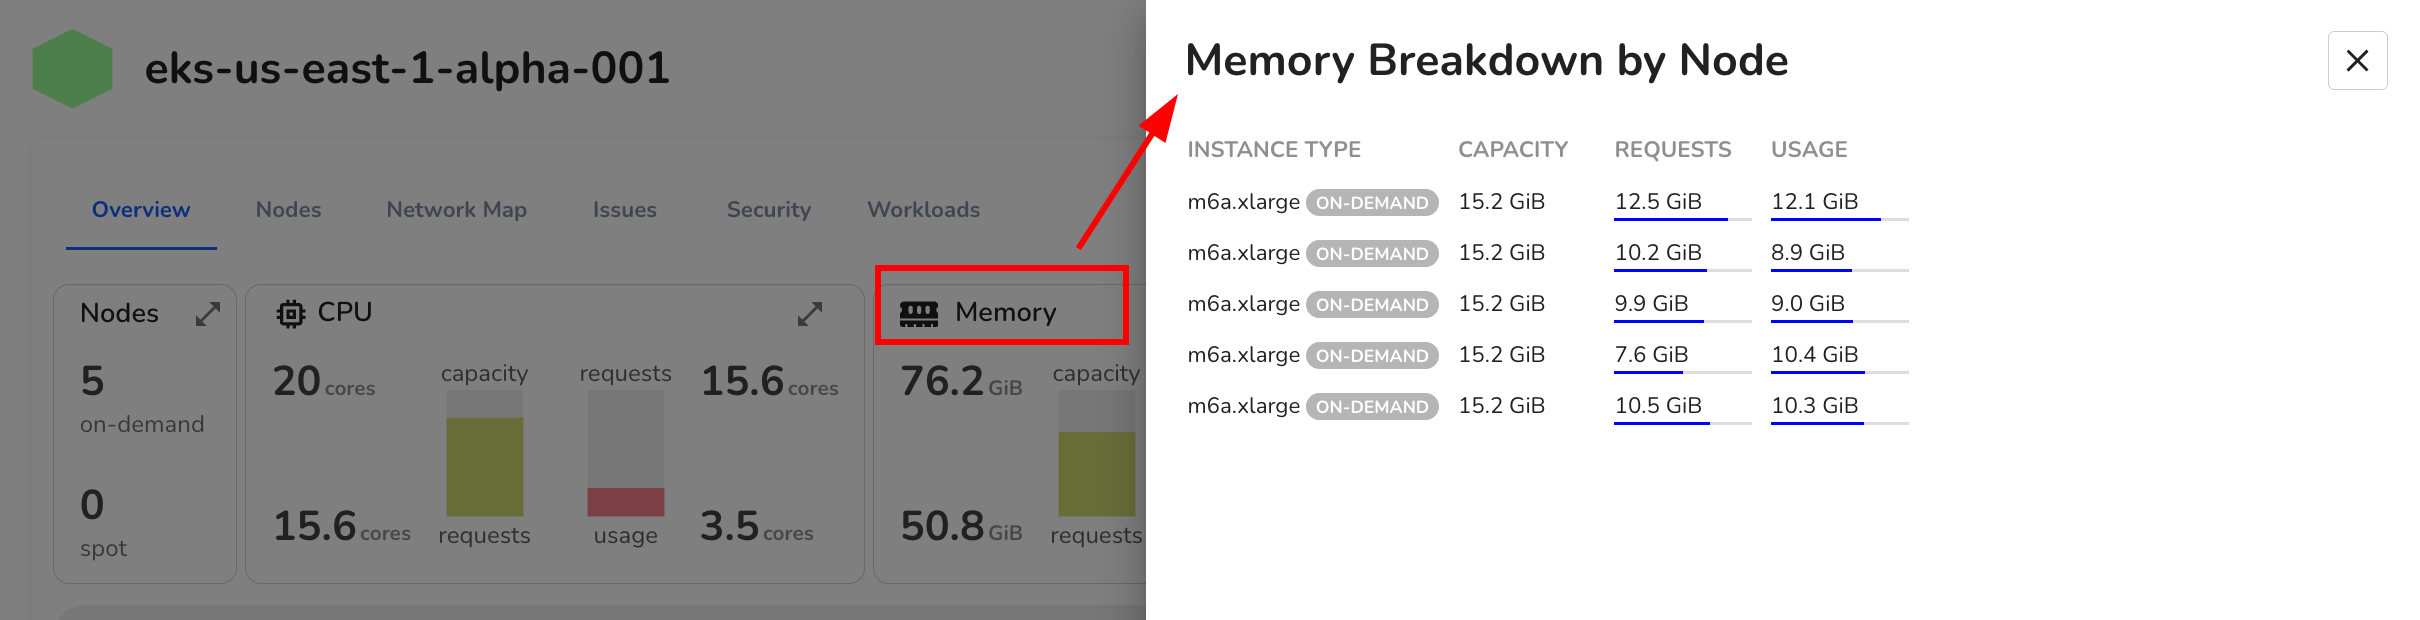
3. Memory
Similar to CPU, the memory panel shows total allocatable memory, requested memory, and current usage. Expanding this view provides node-level memory metrics.
These insights help uncover gaps between requested and actual usage, which is useful for identifying over-provisioned workloads or memory-constrained nodes.
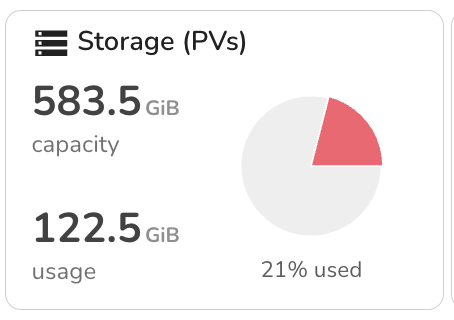
4. Storage (PVs)
Shows the total persistent volume capacity attached to the cluster, and how much is currently in use. This view is helpful for monitoring storage saturation across stateful workloads.
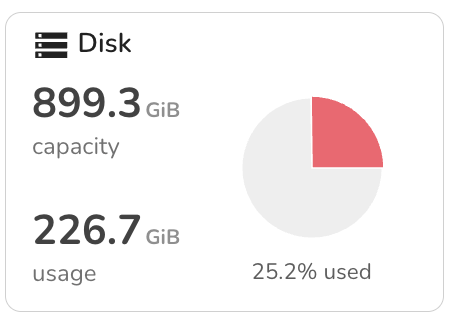
5. Disk
Displays overall disk capacity and usage across the cluster, including ephemeral storage. Useful for detecting long-term disk pressure or sudden spikes that may affect pod scheduling.
These metrics are color-coded to highlight over-commitment or high utilization, allowing engineers to act before workloads are impacted.
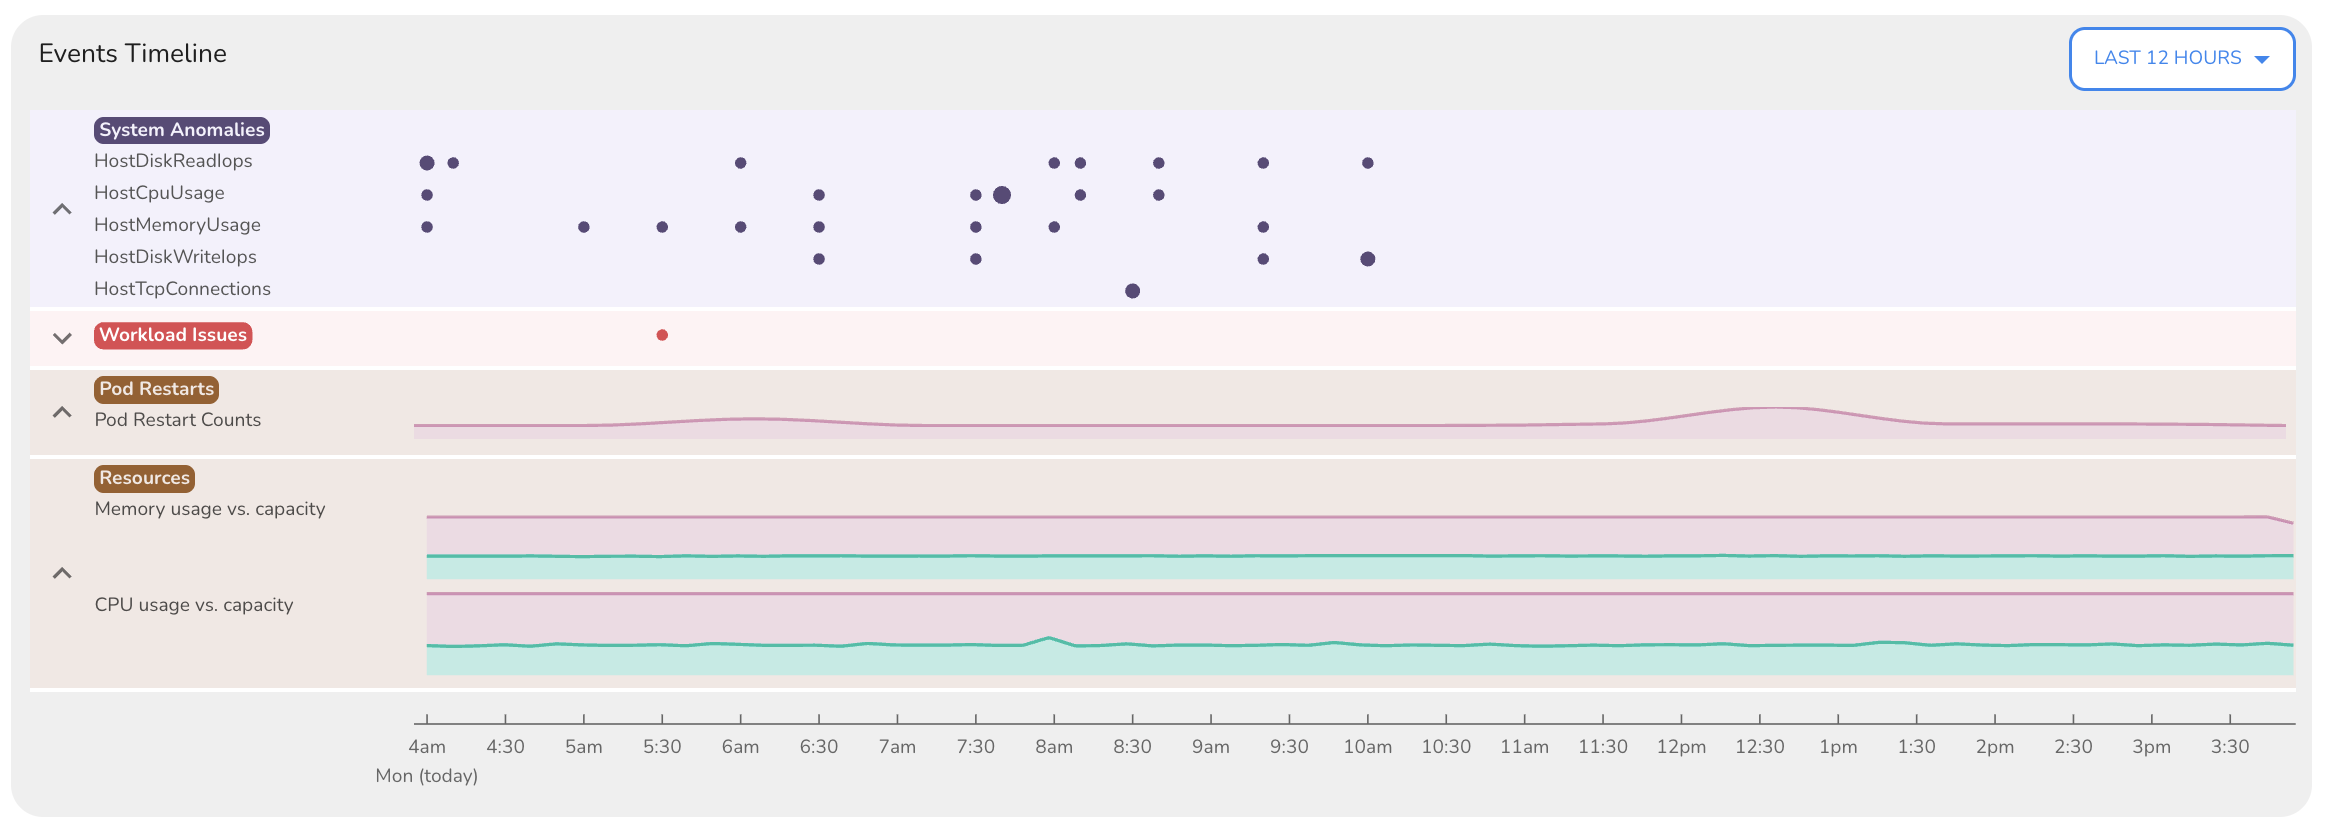
Events Timeline
The Events Timeline surfaces recent activity within the cluster over a selectable time range (e.g., last 12 hours).
It provides a chronological view of key infrastructure and workload events, grouped into logical categories:
- System Anomalies: Includes host-level performance anomalies such as disk IOPS spikes, memory pressure, and high CPU usage across nodes.
- Workload Issues: Automatically detected workload-level issues, such as crashes or degraded pods.
- Pod Restarts: Tracks restart counts, helping to flag unstable deployments.
- Resource Trends: Plots CPU and memory usage against requests and capacity over time.
This timeline enables you to correlate system-level signals with workload behavior, helping you answer questions like “Did the crash follow a memory spike?” or “Were restarts isolated or recurring across the cluster?”
By bringing infrastructure signals and workload-level issues into a single timeline, this view accelerates debugging and reduces the need for context switching during investigations.
Nodes
The Nodes section provides a detailed breakdown of resource allocation and usage across all nodes within the selected cluster.
It offers node-level visibility into memory, CPU, and disk consumption, helping engineers identify imbalances, saturation risks, and inefficient resource allocation.
At the top of the view, you’ll see cluster-wide aggregates for:
- Memory Requests and Usage
- CPU Requests and Usage
- Disk Usage
These metrics offer a quick summary of how resources are requested and consumed across the cluster.
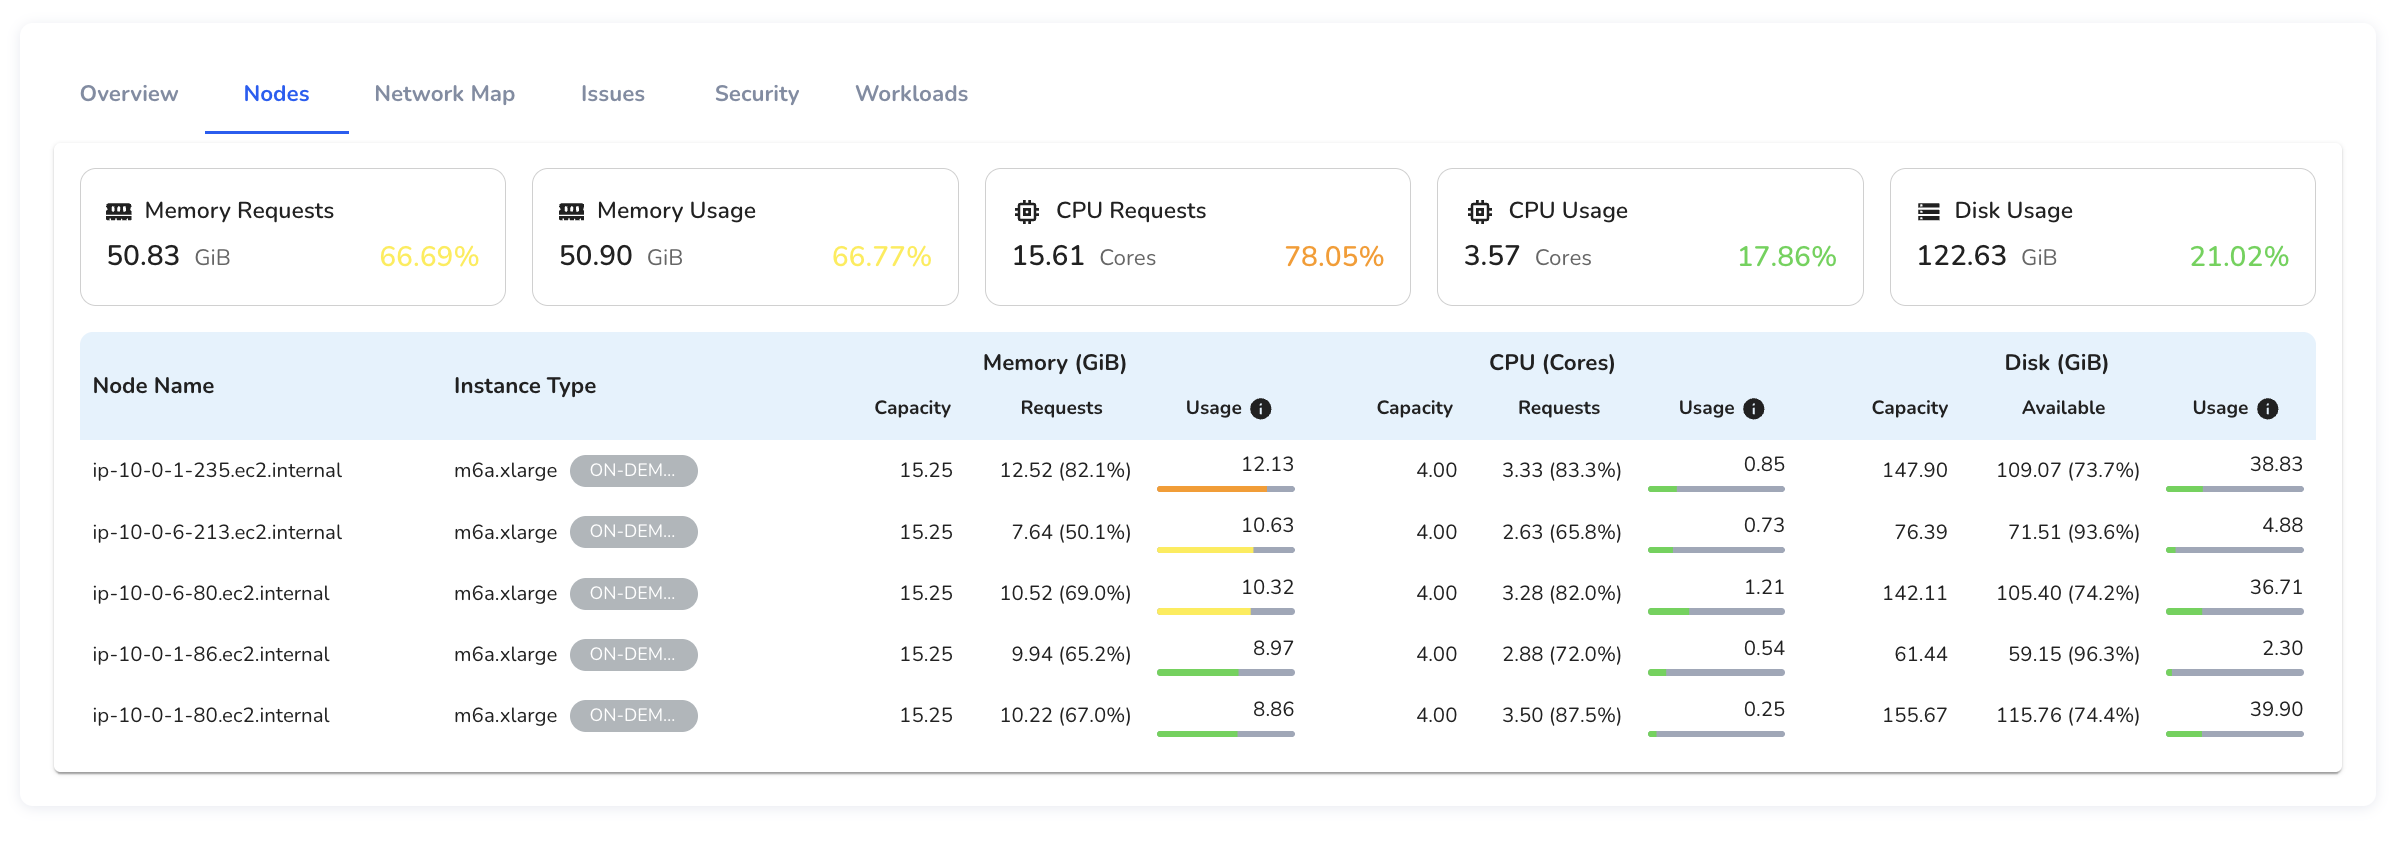
Below this, each node is listed with detailed capacity, request, and usage values for memory, CPU, and disk. Each row in the table corresponds to a node, showing:
- Node Name and Instance Type
- Memory (GiB): Allocatable memory, requested memory, and current usage
- CPU (Cores): Allocatable cores, requested cores, and real-time usage
- Disk (GiB): Disk capacity, available space, and current usage
Usage values are visually color-coded, allowing you to quickly spot nodes under pressure (e.g., memory usage > 80%) or inconsistencies between requested and actual usage.
This view helps identify noisy neighbors, over-provisioned workloads, and nodes at risk of saturation, which is critical for performance tuning, capacity planning, and scheduling efficiency.
For example:
- A node with high memory usage but low CPU usage may indicate uneven workload distribution.
- A node with requests nearing capacity across multiple resources can help anticipate scheduling failures before they happen.
By surfacing these insights in one view, the Nodes tab enables faster, more informed decisions when optimizing cluster performance or diagnosing resource-related issues.
Network Map
The Network Map provides a visual representation of service-to-service communication within your Kubernetes cluster.
It helps engineers understand how workloads interact, identify broken or unhealthy links, and investigate unexpected dependencies between services.
This view is especially useful during debugging or network policy reviews, offering real-time visibility into traffic flow and workload connectivity.
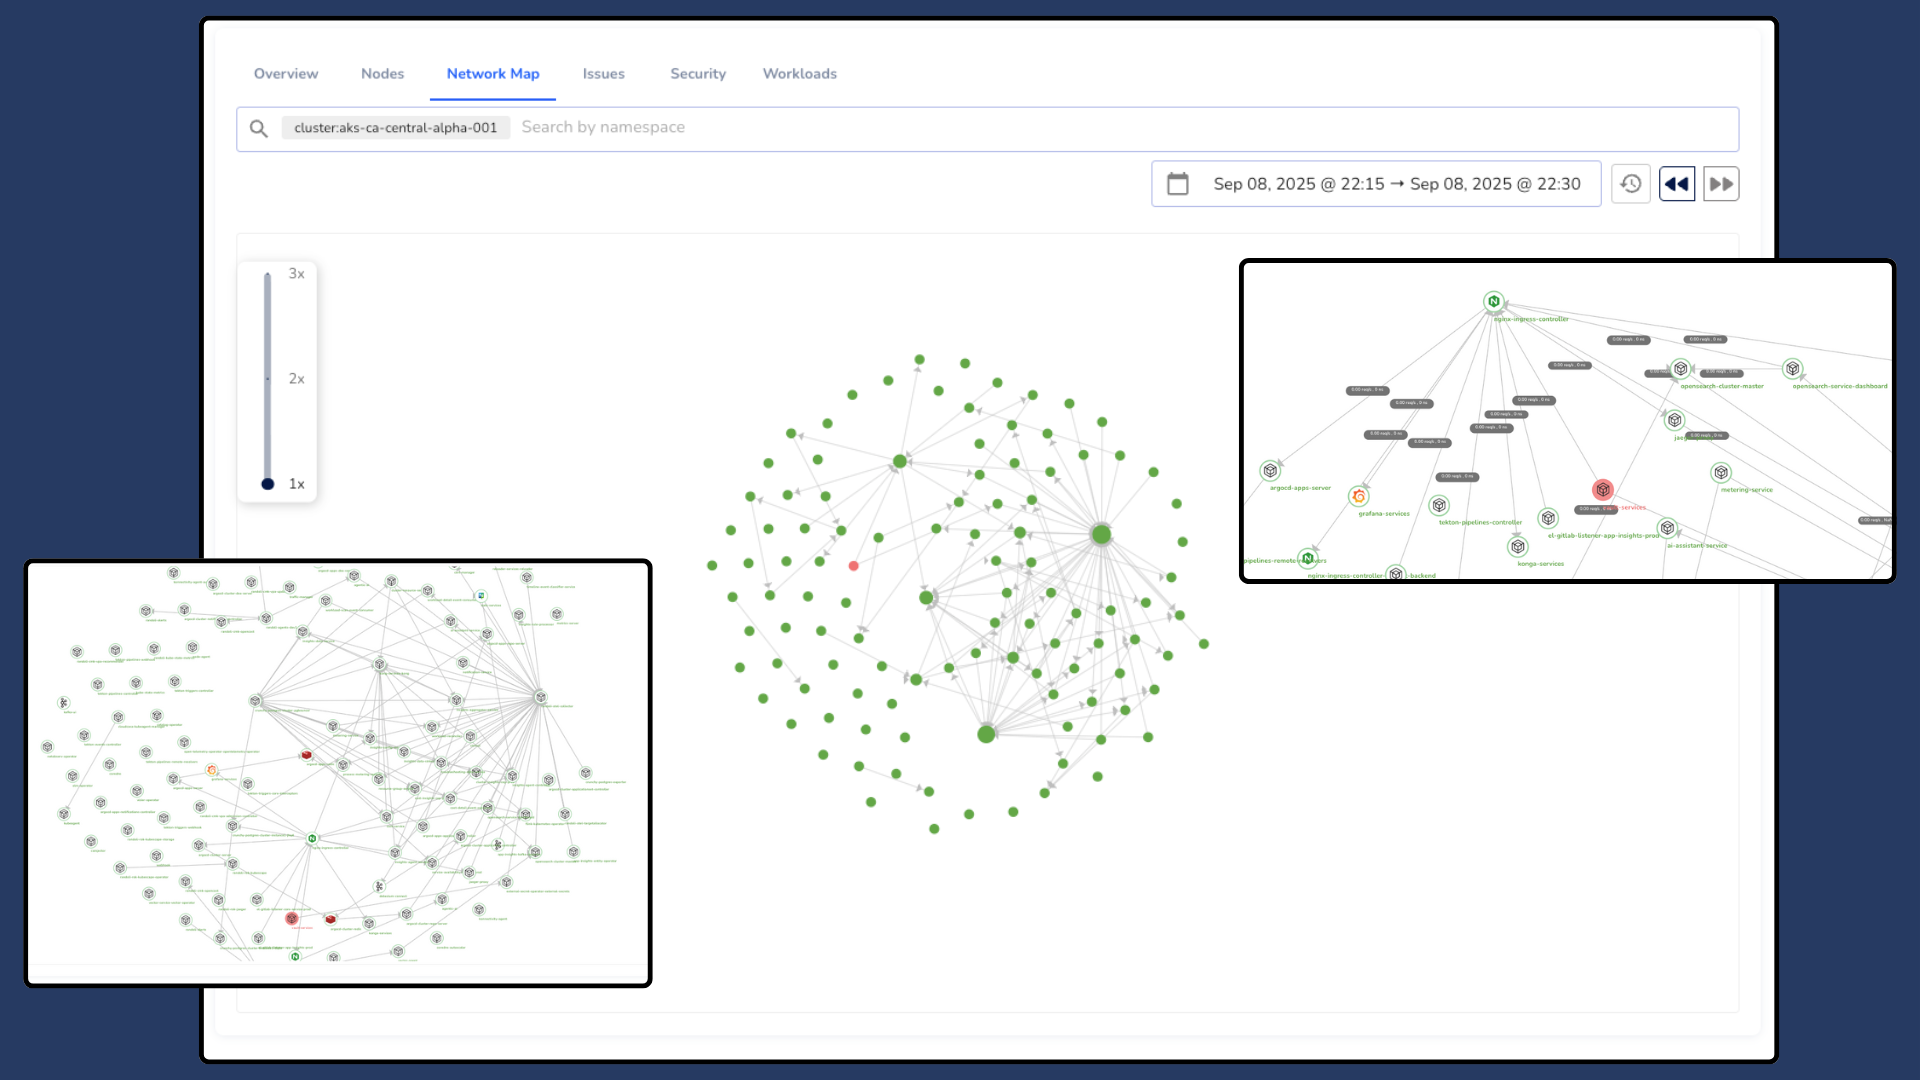
A dedicated page for Network Map functionality will be available soon.
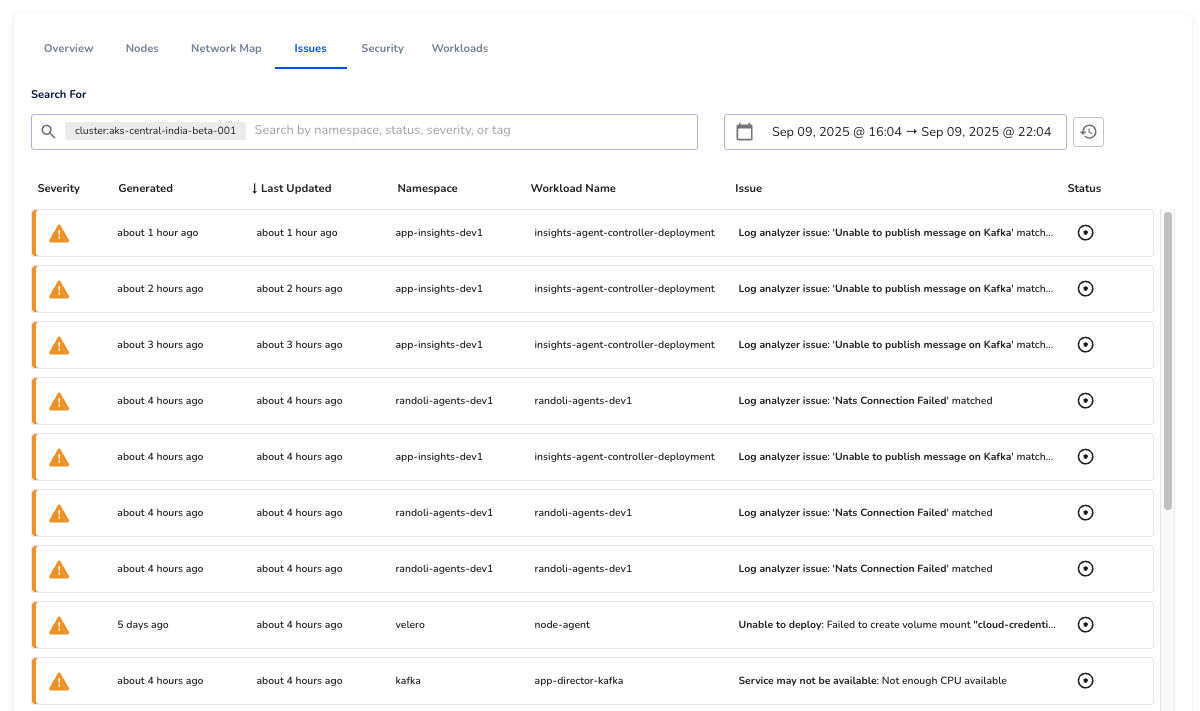
Issues
The Issues tab displays all workload issues automatically detected within the selected cluster.
These include failures such as crash loops, readiness probe failures, or degraded workloads, identified through Randoli’s built-in issue detection engine.
You can filter issues by tags, severity, namespace, or a custom time range to focus your analysis on what’s most relevant.
To learn about automatic issue detection in Randoli, refer to the documentation.
Security
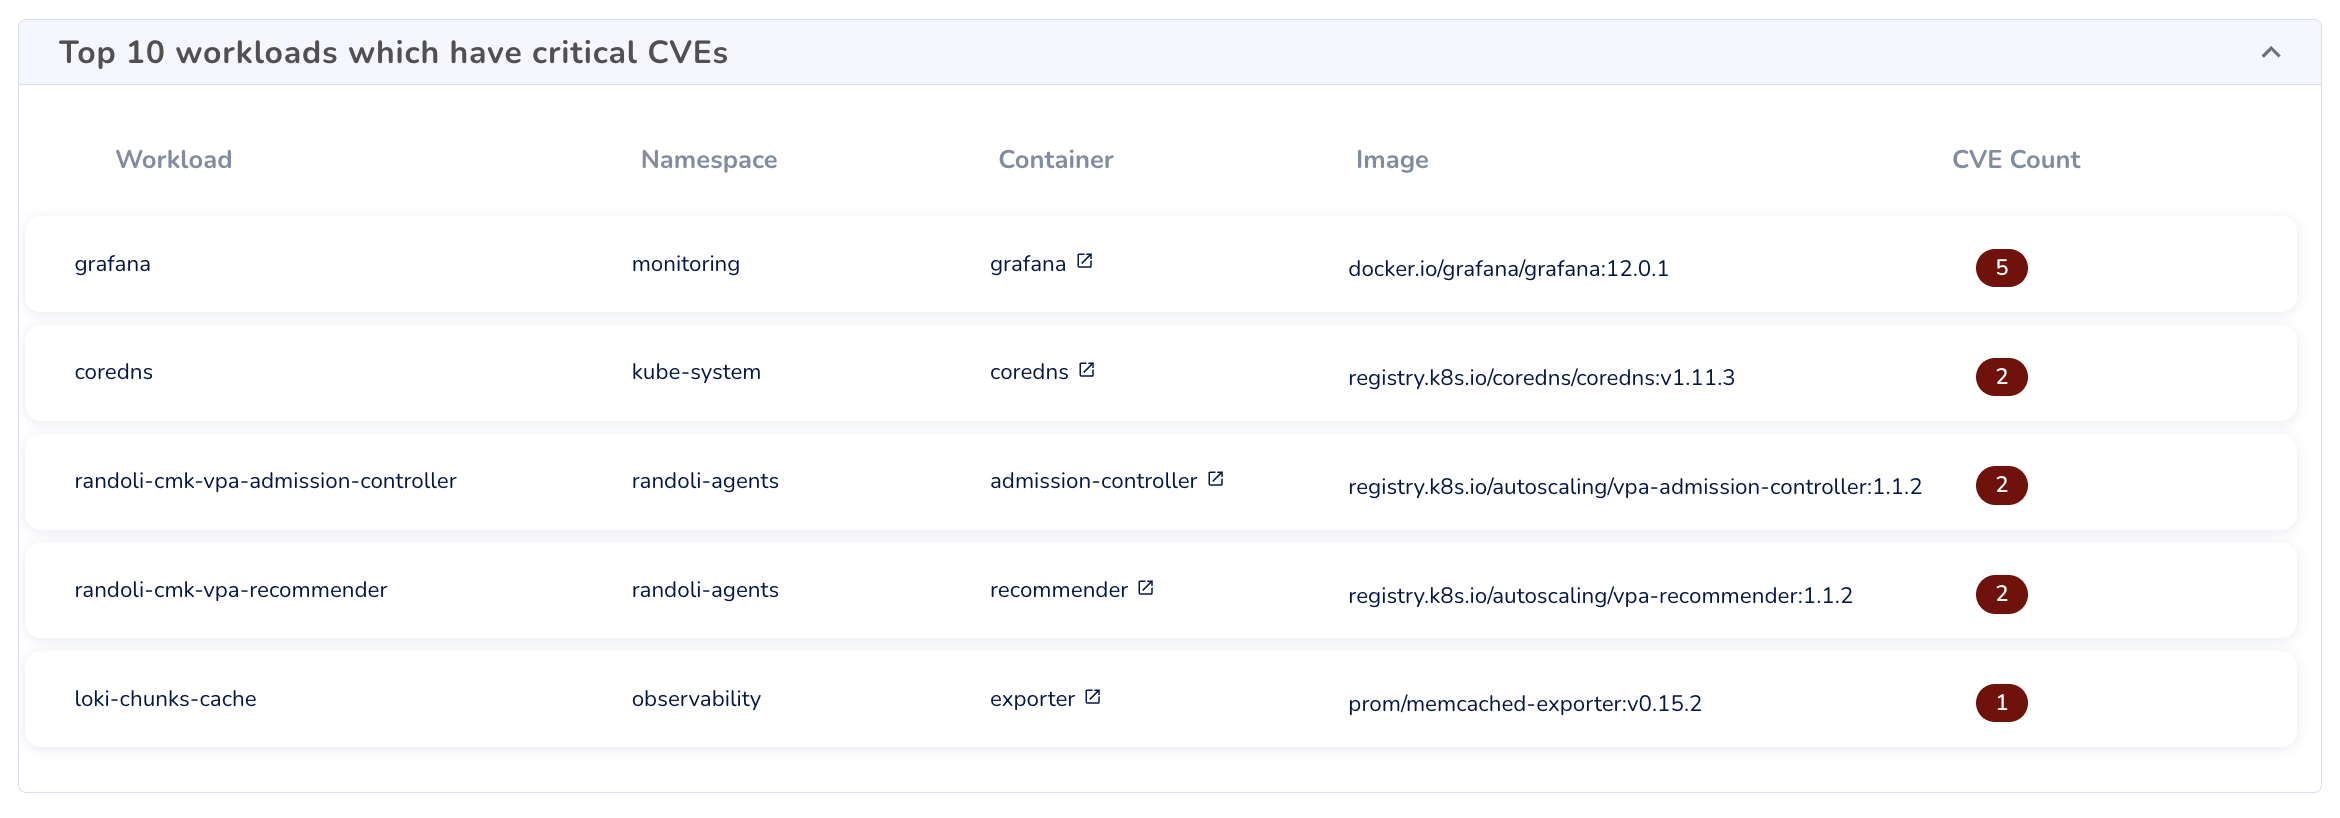
The Security tab provides visibility into critical CVEs and best practice violations detected across workloads in the cluster. It helps engineering teams identify potential risks early and prioritize remediation efforts based on severity and scope.
This view includes:
Top 10 workloads with critical CVEs
Highlights the most at-risk workloads based on the number of critical vulnerabilities detected in associated container images.
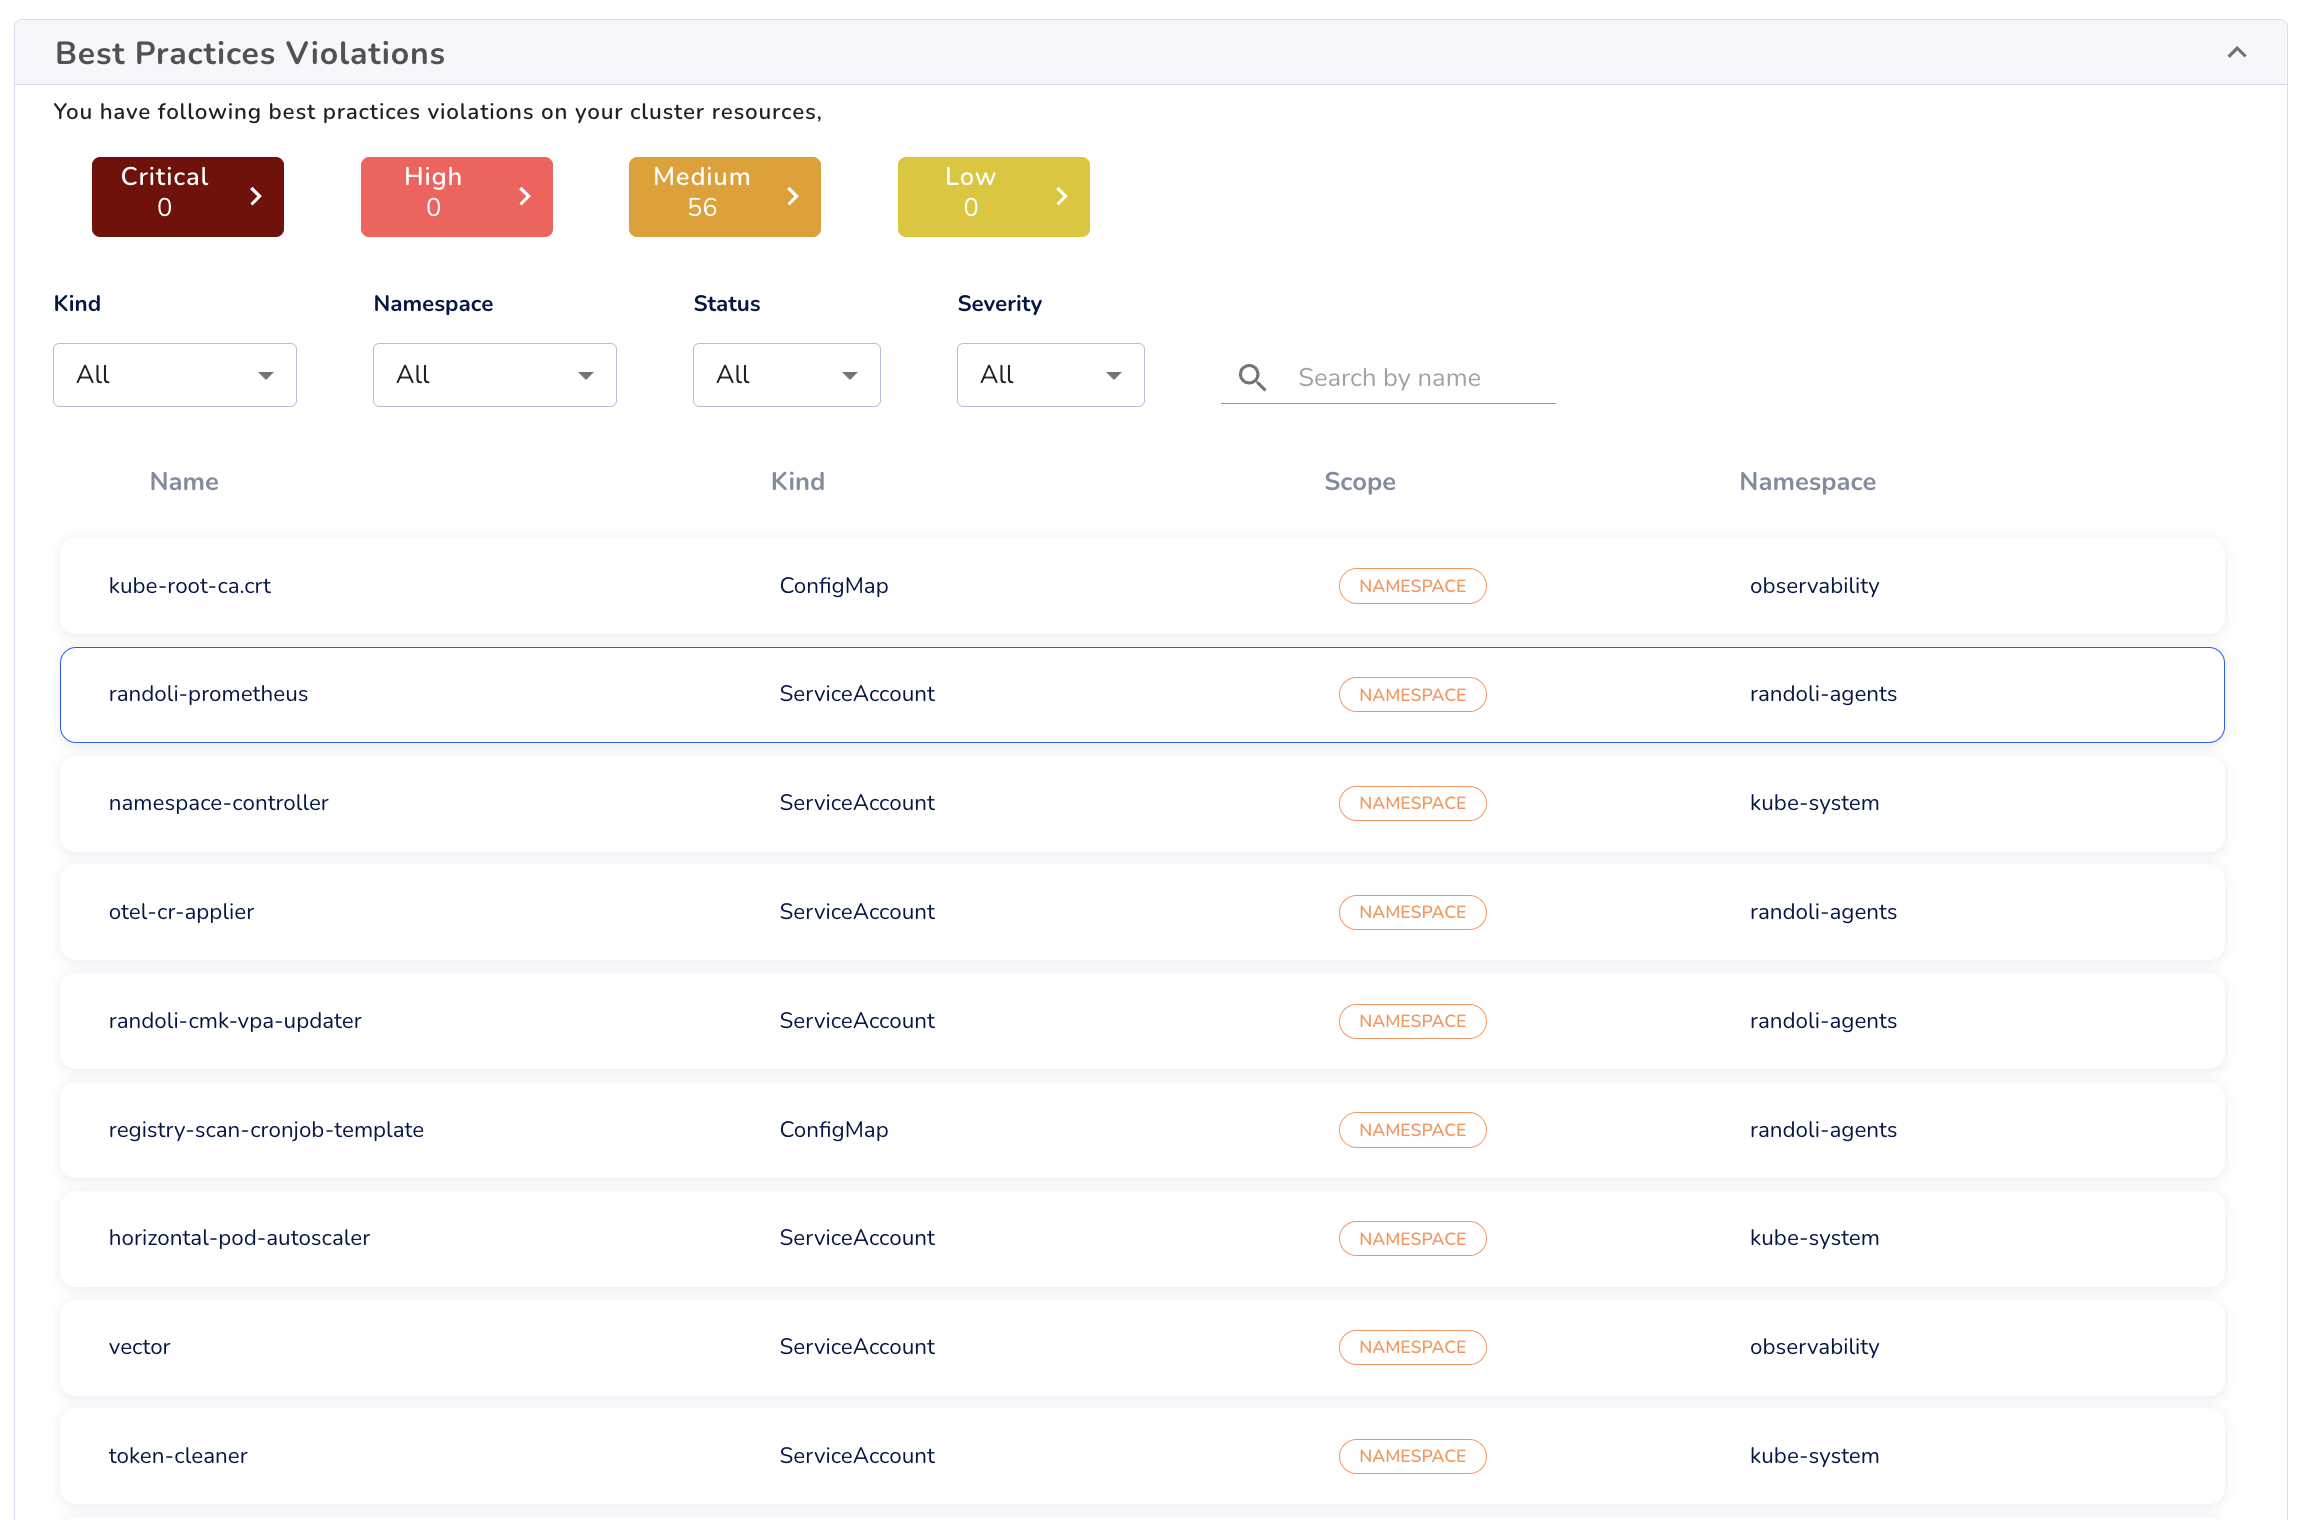
Best Practices Violations
Lists configuration issues that may violate security or operational best practices (e.g., missing RBAC configurations or exposed resources). You can filter violations by severity, namespace, and resource kind.
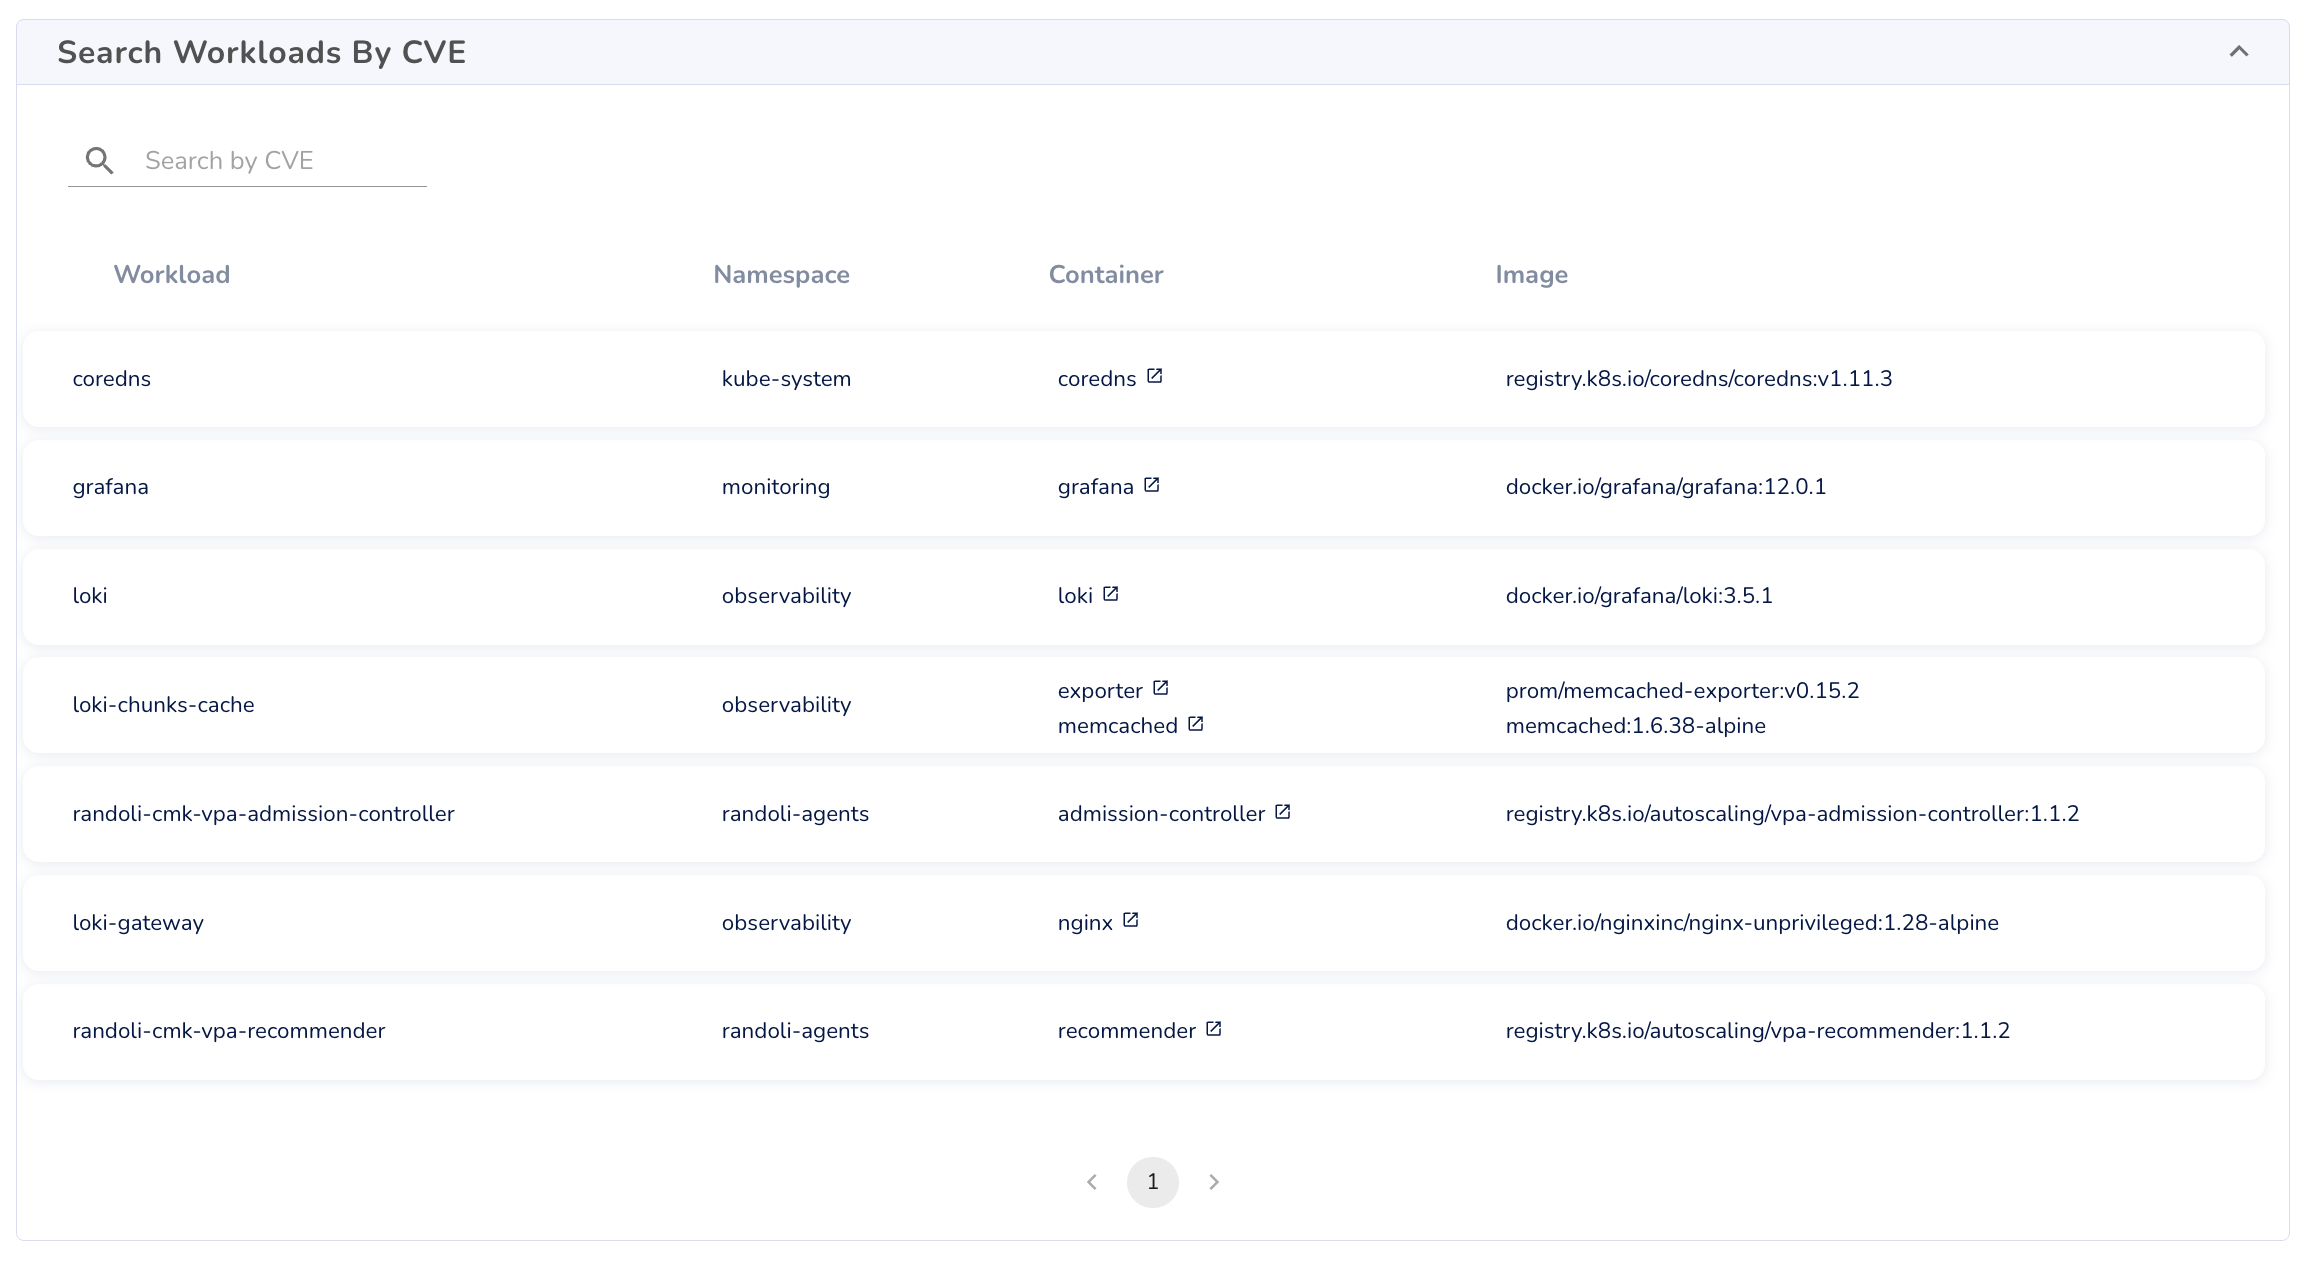
Search Workloads by CVE
Enables targeted inspection of workloads based on specific CVEs, allowing teams to audit image usage and track remediation status.
A dedicated page for Security insights will be available soon. Learn more.
Workloads
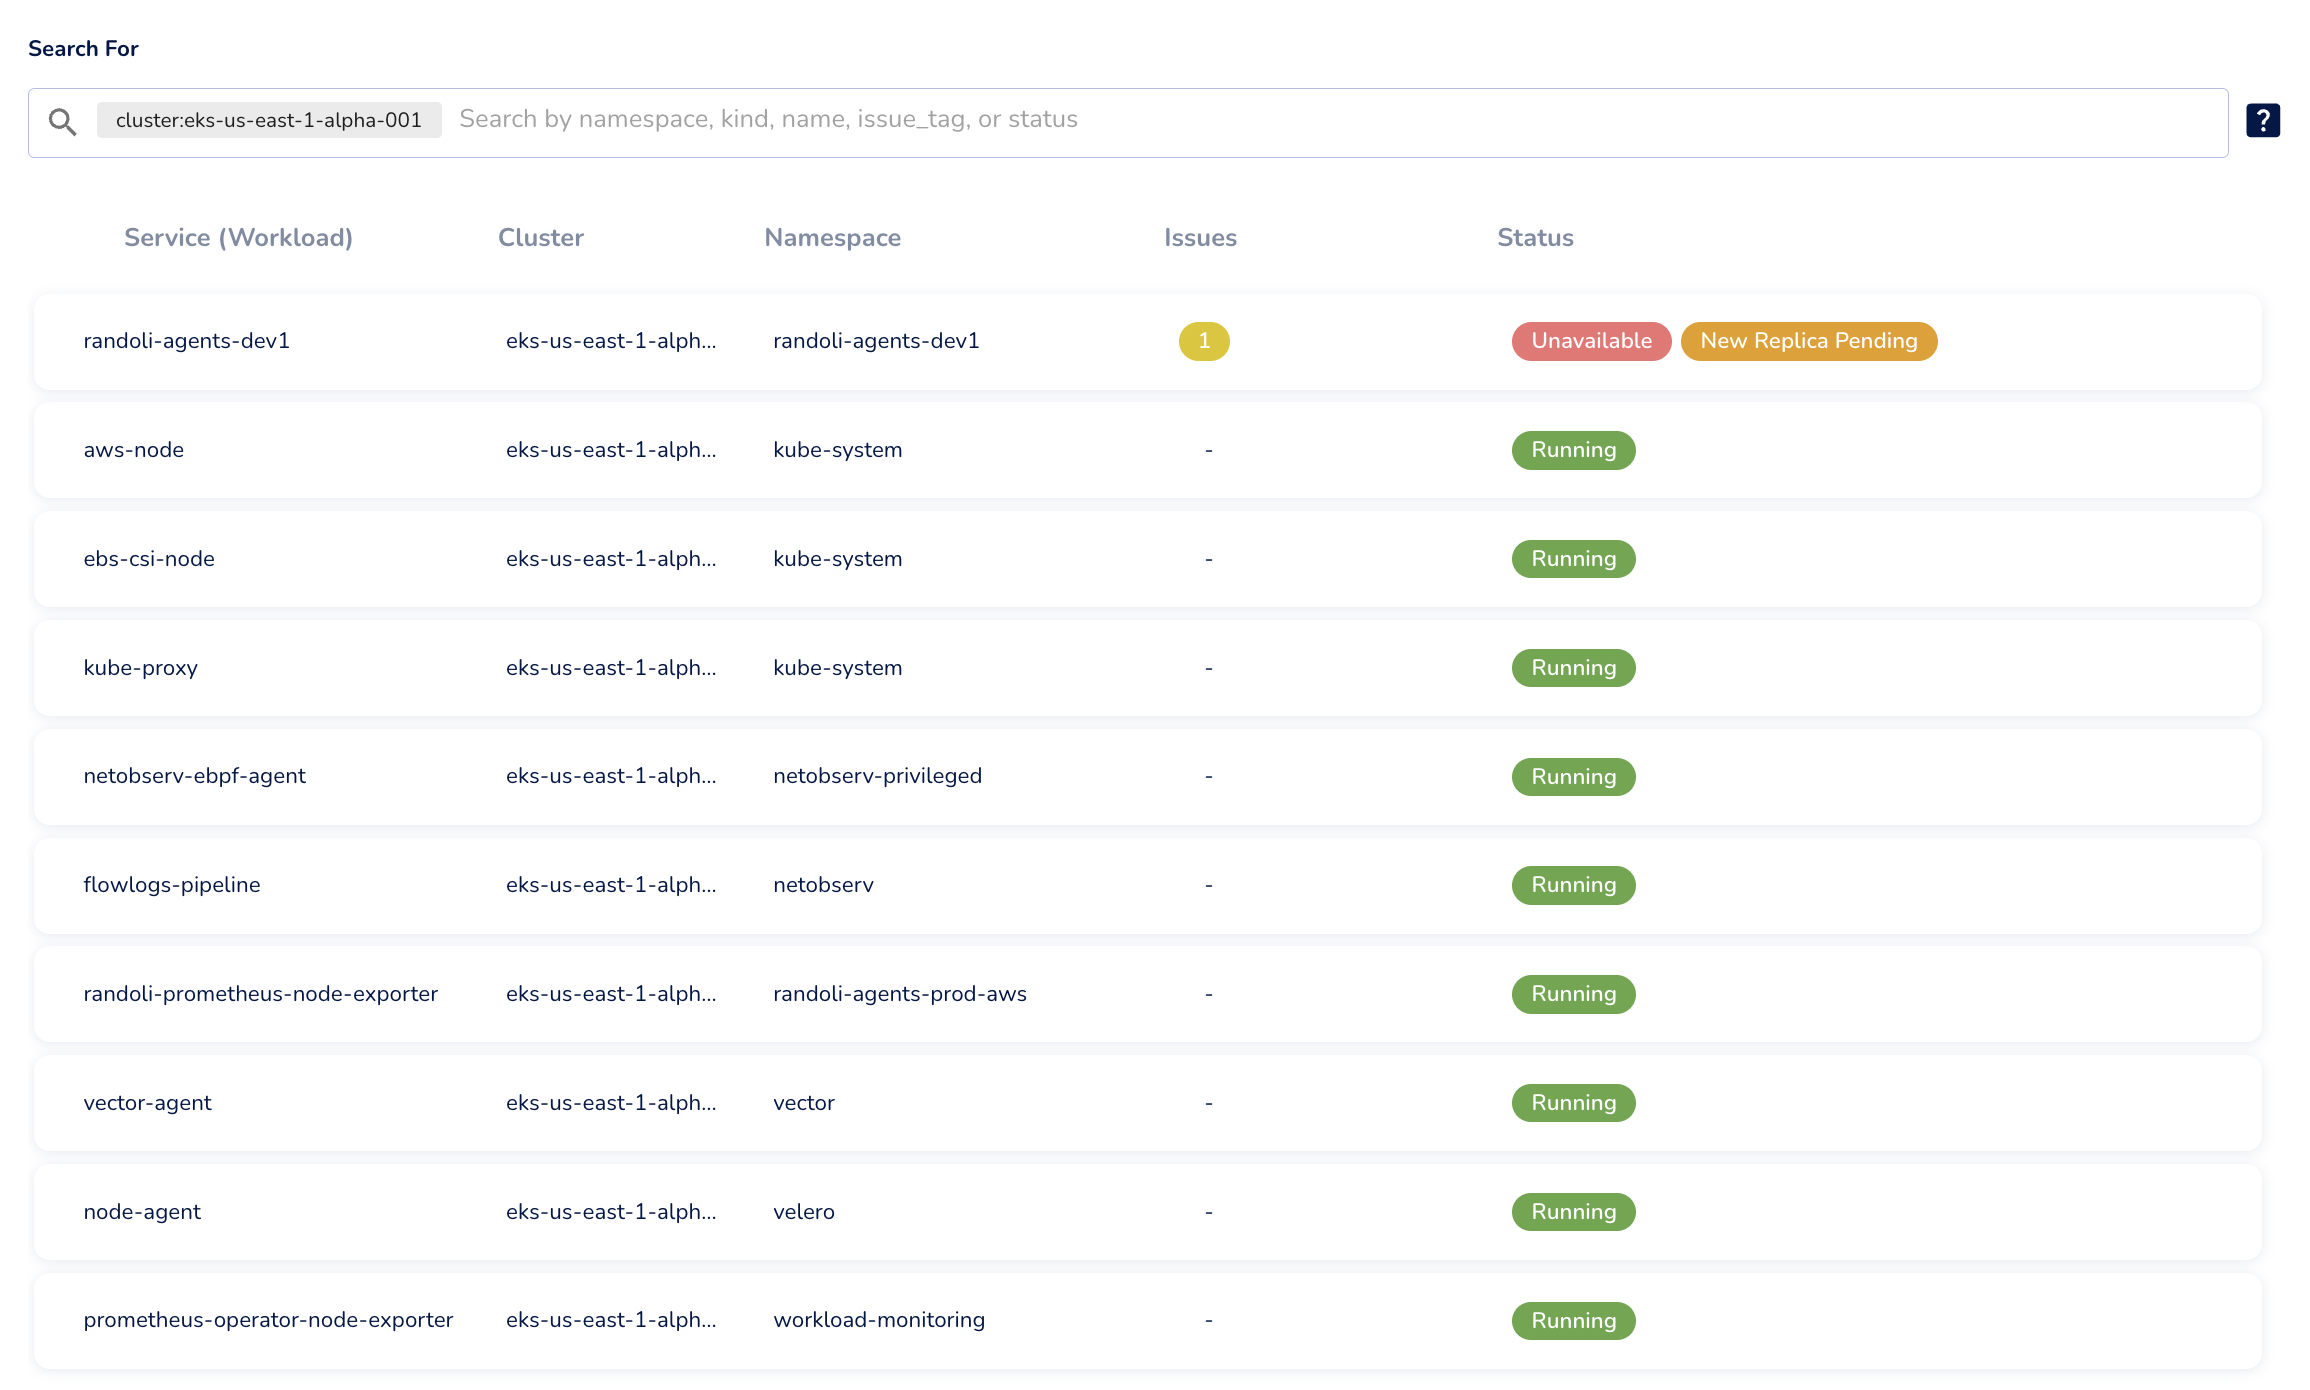
The Workloads tab displays all workloads of the selected cluster.
You can filter the list by namespace, resource kind, name, or issue tag to quickly locate specific workloads or identify those with known problems.
To learn more about using workload search filters, refer to the demo.
Conclusion
The expanded Issue Trends by Cluster view provides a unified, real-time lens into cluster health, workload stability, and resource utilization.
It helps engineering teams move from high-level issue detection to detailed, context-rich analysis—enabling faster investigation and improved operational visibility across Kubernetes environments.
To go deeper, you can explore Application Performance Monitoring for workload-specific metrics and traces, review Built-in Monitors to track critical host & workload-level signals, or use Log Analyzers to scan & detect known error patterns in your logs in real-time.