Apache Kafka Monitoring
Kafka monitoring ensures high availability, optimal performance, and early issue detection. It provides visibility into both broker-level metrics (messages, topics, partitions, replication) and JVM/system metrics (CPU, memory, threads, garbage collection).
By the end of this guide, you will be able to:
- Retrieve Kafka broker metrics via OpenTelemetry.
- Understand the key metrics to monitor for Kafka performance and health.
- Visalize & track Kafka metrics effectively via Randoli Console.
- Leverage Randoli built-in monitors for Kafka to proactively identify issues.
1. Instrumenting Kafka with OpenTelemetry
To collect Kafka metrics using OpenTelemetry, follow the steps given below:
Step 0: Use a Dedicated Collector (Recommended)
We recommend creating a separate OpenTelemetry custom resource (CR) for Kafka monitoring.
This ensures that:
- Database telemetry is isolated from application telemetry.
- Configuration changes to database monitoring do not affect other pipelines.
The configuration mentioned from step 2 should be added to a dedicated OpenTelemetryCollector custom resource.
You must use the Randoli custom OTel Collector image when defining the OTel custom resource.
This image has the randoli_kafka_receiver and the JMX scraper JAR pre-bundled.
Do not replace it with the upstream OTel Collector image, as the custom receiver will not be available.
image: docker.io/randoli/otelcol:v0.146.0-jmx
Step 1: Enable JMX on Kafka Brokers
Kafka brokers expose internal metrics via JMX. This step configures the broker itself and is required regardless of any other configuration.
Enable JMX by setting the following environment variables in your Kafka broker configuration:
export KAFKA_JMX_PORT=9999
export KAFKA_OPTS="-Dcom.sun.management.jmxremote \
-Dcom.sun.management.jmxremote.port=${KAFKA_JMX_PORT} \
-Dcom.sun.management.jmxremote.rmi.port=${KAFKA_JMX_PORT} \
-Dcom.sun.management.jmxremote.authenticate=false \
-Dcom.sun.management.jmxremote.ssl=false \
-Djava.rmi.server.hostname=<BROKER_HOST>"
Replace <BROKER_HOST> with the hostname or IP of your Kafka broker.
We recommend securing the JMX connection with TLS and authentication in production environments.
If you have any questions, please contact us via the support portal.
Step 2: Configure the Randoli Kafka Receiver
The randoli_kafka_receiver is Randoli's custom OTel receiver for Kafka.
It consolidates what previously required three separate receivers: per-broker JMX metrics, cluster-wide Kafka metrics, and consumer group lag, into a single receiver block.
This significantly reduces configuration complexity without sacrificing coverage.
Add the following under the spec.receivers section:
receivers:
  randoli_kafka_receiver:
    brokers:
      - <BROKER_0_HOST>.<HEADLESS_SERVICE>.<NAMESPACE>.svc:9092
      - <BROKER_1_HOST>.<HEADLESS_SERVICE>.<NAMESPACE>.svc:9092
      - <BROKER_2_HOST>.<HEADLESS_SERVICE>.<NAMESPACE>.svc:9092
    collection_interval: 30s
    kafka_metrics:
      scrapers: ["brokers", "topics", "consumers"]
    jmx_metrics:
      port: 9999
      target_system: "kafka,jvm"
      jar_path: "/otel-jars/opentelemetry-jmx-scraper.jar"
Make sure to replace the following placeholders:
<BROKER_N_HOST>: Hostname of the Kafka broker (e.g.kafka-0)<HEADLESS_SERVICE>: The headless service name for your Kafka brokers (e.g.kafka-brokers)<NAMESPACE>: The Kubernetes namespace where Kafka is running (e.g.kafka)
The jmx_metrics.port value (9999) corresponds to the JMX port you configured in Step 1.
jmx_configs - Custom Metrics (Optional)The jmx_configs field points to a configmap that defines custom JMX metric mappings. This is used when you need metrics beyond what target_system provides out of the box.
jmx_metrics:
  port: 9999
  target_system: "kafka,jvm"
  jar_path: "/otel-jars/opentelemetry-jmx-scraper.jar"
  jmx_configs: "/etc/otelcol/kafka-jmx-mappings.yaml" # custom JMX metric mappings
To use this, you need to create a ConfigMap containing your custom rules YAML and mount it into the collector pod. See the OpenTelemetry JMX metrics configuration files documentation for the YAML syntax.
If you do not have custom metrics requirements, you can omit the jmx_configs field entirely and rely on target_system alone.
Step 3: Configure Processors
Processors enrich, transform, and control the flow of metrics before export. Add the following under the spec.processors section:
processors:
  # Protects the collector from memory exhaustion
  memory_limiter:
    check_interval: 1s
    limit_mib: 1000
    spike_limit_mib: 500

  # Batches metrics for efficient export
  batch:
    send_batch_max_size: 10000
    timeout: 5s

  # Promotes consumer host IP to a resource attribute so k8sattributes
  # can correlate it with the actual Kubernetes pod consuming from Kafka
  transform:
    metric_statements:
      - context: datapoint
        statements:
          - set(resource.attributes["k8s.pod.ip"], attributes["consumer_host_ip"])

  # Enriches metrics with Kubernetes metadata using the pod IP resolved above
  k8sattributes:
    auth_type: serviceAccount
    passthrough: false
    extract:
      metadata:
        - k8s.namespace.name
        - k8s.pod.name
        - k8s.node.name
    pod_association:
      - sources:
          - from: resource_attribute
            name: k8s.pod.ip

  # Sets service.name for grouping metrics in Randoli, and removes the
  # dynamic consumer_host_ip attribute to reduce metric cardinality
  resource:
    attributes:
      - action: upsert
        key: service.name
        value: <KAFKA_CLUSTER_NAME>  # e.g. payments-kafka
      - action: delete
        key: consumer_host_ip
Replace <KAFKA_CLUSTER_NAME> with a logical name for your Kafka cluster. This is how the cluster will appear in the Randoli console (e.g. payments-kafka).
Step 4: Configure the OTLP Exporter
Define the OTLP exporter that forwards metrics to the Randoli collector, under the spec.exporters section:
exporters:
  otlp/main-collector:
    endpoint: randoli-otel-collector.randoli-agents.svc:4317
    tls:
      insecure: true
Step 5: Define the Service Pipeline
After defining receivers, processors, and exporters, wire them together under the spec.service.pipelines section:
service:
  pipelines:
    metrics:
      receivers:
        - randoli_kafka_receiver
      processors:
        - memory_limiter
        - transform
        - k8sattributes
        - resource
        - batch
      exporters:
        - otlp/main-collector
Step 6: Define RBAC Resources
The collector requires a ServiceAccount with permission to read pod and namespace metadata from the Kubernetes API.
This is used by the k8sattributes processor (defined in step 3) to enrich metrics with Kubernetes context. Apply the following alongside your OpenTelemetryCollector resource:
apiVersion: v1
kind: ServiceAccount
metadata:
  name: randoli-otel-kafka-receiver
  namespace: randoli-agents

---

apiVersion: rbac.authorization.k8s.io/v1
kind: ClusterRole
metadata:
  name: randoli-otel-kafka-receiver
rules:
  - apiGroups: [""]
    resources:
      - pods
      - namespaces
    verbs: ["get", "list", "watch"]

---

apiVersion: rbac.authorization.k8s.io/v1
kind: ClusterRoleBinding
metadata:
  name: randoli-otel-kafka-receiver
subjects:
  - kind: ServiceAccount
    name: randoli-otel-kafka-receiver-collector
    namespace: randoli-agents
roleRef:
  kind: ClusterRole
  name: randoli-otel-kafka-receiver
  apiGroup: rbac.authorization.k8s.io
2. Full OpenTelemetryCollector Resource Configuration
Click to expand
apiVersion: opentelemetry.io/v1beta1
kind: OpenTelemetryCollector
metadata:
  name: randoli-otel-kafka-receiver
  namespace: randoli-agents
spec:
  # -----------------------------------------------------------------------
  # IMPORTANT: Use the Randoli custom OTel Collector image.
  # The randoli_kafka_receiver and JMX scraper JAR are pre-bundled.
  # Do not replace with the upstream OTel Collector image.
  # -----------------------------------------------------------------------
  image: docker.io/randoli/otelcol:v0.146.0-jmx
  serviceAccount: randoli-otel-kafka-receiver
  imagePullPolicy: Always
  mode: deployment
  replicas: 1
  config:
    receivers:
      randoli_kafka_receiver:
        brokers:
          - <BROKER_0_HOST>.<HEADLESS_SERVICE>.<NAMESPACE>.svc:9092
          - <BROKER_1_HOST>.<HEADLESS_SERVICE>.<NAMESPACE>.svc:9092
          - <BROKER_2_HOST>.<HEADLESS_SERVICE>.<NAMESPACE>.svc:9092
        collection_interval: 30s
        kafka_metrics:
          scrapers: ["brokers", "topics", "consumers"]
        jmx_metrics:
          port: 9999
          target_system: "kafka,jvm"
          jar_path: "/otel-jars/opentelemetry-jmx-scraper.jar"

    processors:
      memory_limiter:
        check_interval: 1s
        limit_mib: 1000
        spike_limit_mib: 500
      batch:
        send_batch_max_size: 10000
        timeout: 5s
      transform:
        metric_statements:
          - context: datapoint
            statements:
              - set(resource.attributes["k8s.pod.ip"], attributes["consumer_host_ip"])
      k8sattributes:
        auth_type: serviceAccount
        passthrough: false
        extract:
          metadata:
            - k8s.namespace.name
            - k8s.pod.name
            - k8s.node.name
        pod_association:
          - sources:
              - from: resource_attribute
                name: k8s.pod.ip
      resource:
        attributes:
          - action: upsert
            key: service.name
            value: <KAFKA_CLUSTER_NAME>
          - action: delete
            key: consumer_host_ip

    exporters:
      otlp/main-collector:
        endpoint: randoli-otel-collector.randoli-agents.svc:4317
        tls:
          insecure: true

    service:
      pipelines:
        metrics:
          receivers:
            - randoli_kafka_receiver
          processors:
            - memory_limiter
            - transform
            - k8sattributes
            - resource
            - batch
          exporters:
            - otlp/main-collector

      telemetry:
        logs:
          level: info
        metrics:
          readers:
            - pull:
                exporter:
                  prometheus:
                    host: 0.0.0.0
                    port: 8888
3. Visualizing Kafka Metrics in Randoli
Once Kafka is instrumented and telemetry is flowing, you can access the built-in Kafka Metrics Dashboard from the Randoli UI.
The dashboard provides a unified view of cluster health, broker performance, traffic patterns, and consumer lag, allowing you to quickly identify bottlenecks, instability, or imbalance across brokers.
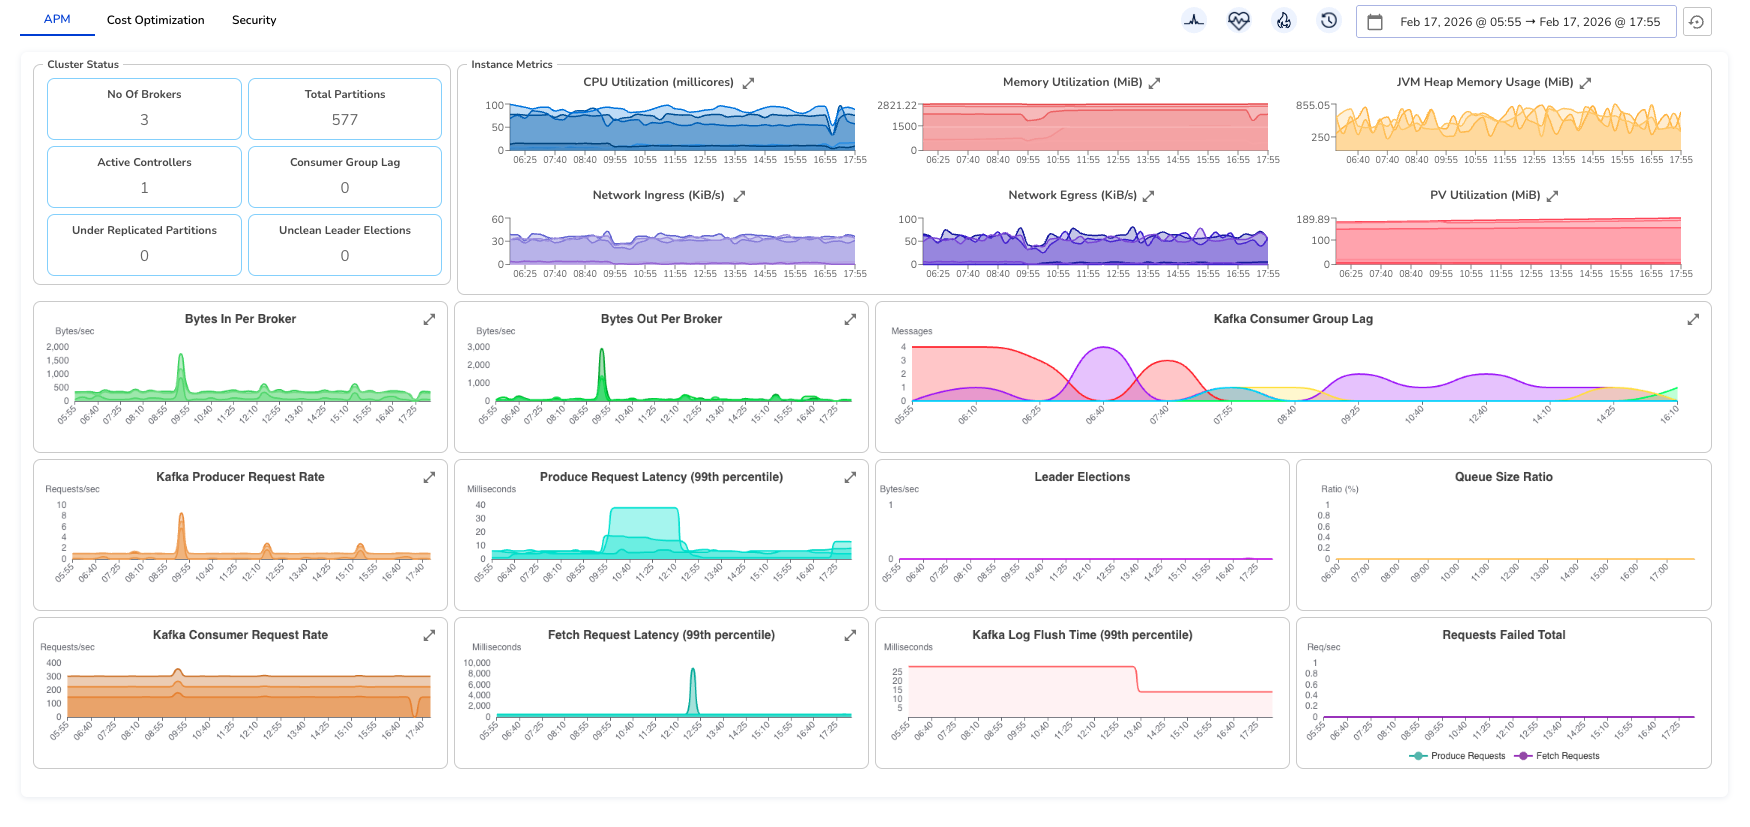
Cluster Status
At the top of the dashboard, the Cluster Status section provides a quick health summary:
- No. of Brokers: Total active brokers in the cluster.
- Total Partitions: Total partitions across all topics.
- Active Controllers: Number of controller nodes (should typically be 1).
- Consumer Group Lag: Aggregated lag across all consumer groups.
- Under Replicated Partitions: Partitions not fully replicated (should be 0).
- Unclean Leader Elections: Count of unsafe leader elections (should be 0).
This section gives you an immediate snapshot of cluster stability.
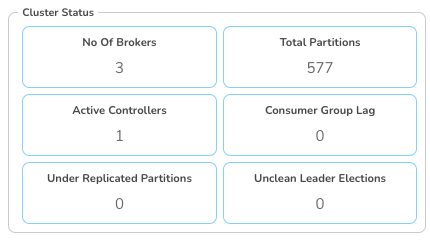
Instance Metrics
The Instance Metrics section provides per-broker infrastructure visibility.
- CPU Utilization (millicores): Shows CPU consumption per broker. Spikes may indicate traffic bursts or imbalanced workloads.
- Memory Utilization (MiB): Tracks broker memory usage. Sustained high usage may indicate memory pressure or GC tuning requirements.
- JVM Heap Memory Usage (MiB): Displays heap usage across brokers. Useful for diagnosing GC behavior and memory leaks.
- Network Ingress (KiB/s): Incoming traffic to brokers. Helps identify traffic distribution patterns.
- Network Egress (KiB/s): Outgoing traffic from brokers. Useful for replication and consumer activity analysis.
- PV Utilization (MiB): Persistent volume usage per broker. Helps track disk growth and capacity risks.
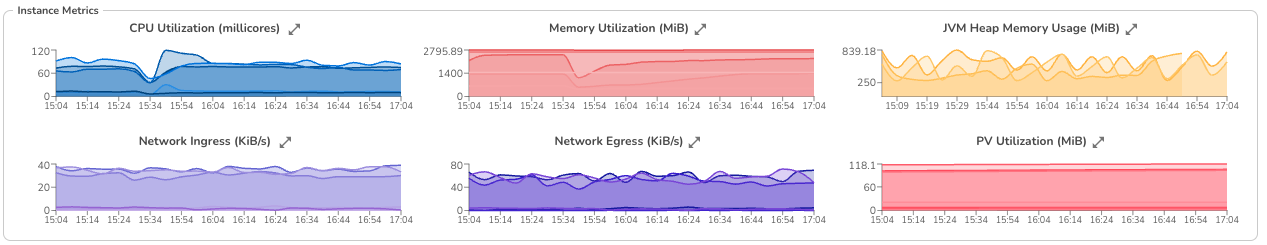
Expanding and Filtering Instance Metrics
Each graph includes an expand icon in the top-right corner. When expanded:
- You can view a breakdown by individual broker instances
- Hover to see exact values per instance
- Filter the chart to focus on a single broker
This behavior is consistent across all instance-level graphs.
Traffic & Throughput Metrics
- Bytes In Per Broker: Incoming data rate per broker. Helps detect uneven load distribution.
- Bytes Out Per Broker: Outgoing data rate per broker. Useful for identifying replication or consumer-heavy workloads.
- Kafka Producer Request Rate: Number of produce requests per second. Reflects producer activity.
- Kafka Consumer Request Rate: Number of produce requests per second. Reflects producer activity.
Latency Metrics
- Produce Request Latency (99th percentile): High latency indicates broker overload, disk pressure, or replication delays.
- Fetch Request Latency (99th percentile): Indicates how quickly consumers receive messages. Spikes may signal I/O or network issues.
- Kafka Log Flush Time (99th percentile): Time taken to flush data to disk. Sustained increases may indicate disk bottlenecks.
Replication & Stability Metrics
- Kafka Consumer Group Lag: Shows lag per consumer group. (expandable for more in-depth breakdown by group, topic or partition)
- Leader Elections: Tracks leader election events. Frequent elections may indicate broker instability.
- Queue Size Ratio: Indicates request queue saturation. High values may suggest thread pool exhaustion.
- Requests Failed Total: Total failed produce/fetch requests. Non-zero values require immediate investigation.
Together, this view gives you end-to-end visibility into Kafka. From cluster health to per-broker performance and consumer behavior, so you can detect issues early and maintain stable, predictable data flow across your brokers.
4. Key Kafka Metrics to Monitor
The table below summarizes some important Kafka metrics collected by the Randoli agent via OpenTelemetry, which helps you to monitor for performance, reliability, and cluster health.
| Category | Metric | Type | Description |
|---|---|---|---|
| Traffic / Throughput | Message Count (kafka_message_count_total) | Counter | Total messages handled by the broker. |
Network I/O Bytes (kafka_network_io_bytes_total) | Counter | Total data sent and received by the broker. | |
Request Count (kafka_request_count_total) | Counter | Total client requests processed by the broker. | |
| Request Load & Errors | Request Failed Total (kafka_request_failed_total) | Counter | Failed requests; spikes indicate reliability issues. |
Request Queue Size (kafka_request_queue) | Gauge | Number of requests waiting to be processed. | |
Purgatory Size (kafka_purgatory_size) | Gauge | Backlog of delayed requests; high values suggest overload. | |
| Latency | Request Latency p50 (kafka_request_time_50p_milliseconds) | Gauge | Typical request processing time. |
Request Latency p99 (kafka_request_time_99p_milliseconds) | Gauge | Worst-case request latency. | |
Log Flush Latency p99 (kafka_log_flush_latency_99p) | Histogram | Disk flush time; high values indicate I/O pressure. | |
| Partitions & Replication | Partition Count (kafka_partition_count) | Gauge | Total number of partitions on the broker. |
Under-replicated Partitions (kafka_partition_underReplicated) | Gauge | Partitions missing replicas; risk if greater than 0. | |
Offline Partitions (kafka_partition_offline) | Gauge | Unavailable partitions; critical if greater than 0. | |
Replication Lag Max (kafka_replication_lag_max) | Gauge | Maximum lag between leader and follower replicas. | |
| Controller & Stability | Active Controller Count (kafka_controller_active_count) | Gauge | Should be exactly 1 for cluster stability. |
Leader Elections (kafka_leaderElection_count_total) | Counter | Total leader elections; frequent spikes indicate instability. | |
Unclean Leader Elections (kafka_leaderElection_unclean_count_total) | Counter | Risky elections that may cause data loss. |