
Introduction
Randoli helps platform teams, SREs, and DevOps engineers gain complete visibility into their systems and optimize costs, without compromising on data ownership or performance.
Built on an OpenTelemetry-native foundation, Randoli’s unique federated control plane approach combines the simplicity & convinience of a managed experience with the flexibility of keeping your telemetry data within your environment
With Randoli, you get a unified platform to monitor infrastructure, analyze application performance, cost-efficient log analysis and much more, all in one place, designed to scale with your environment, it adapts effortlessly as your systems grow and evolve.
Federated Control Planes - Our Approach to Observability
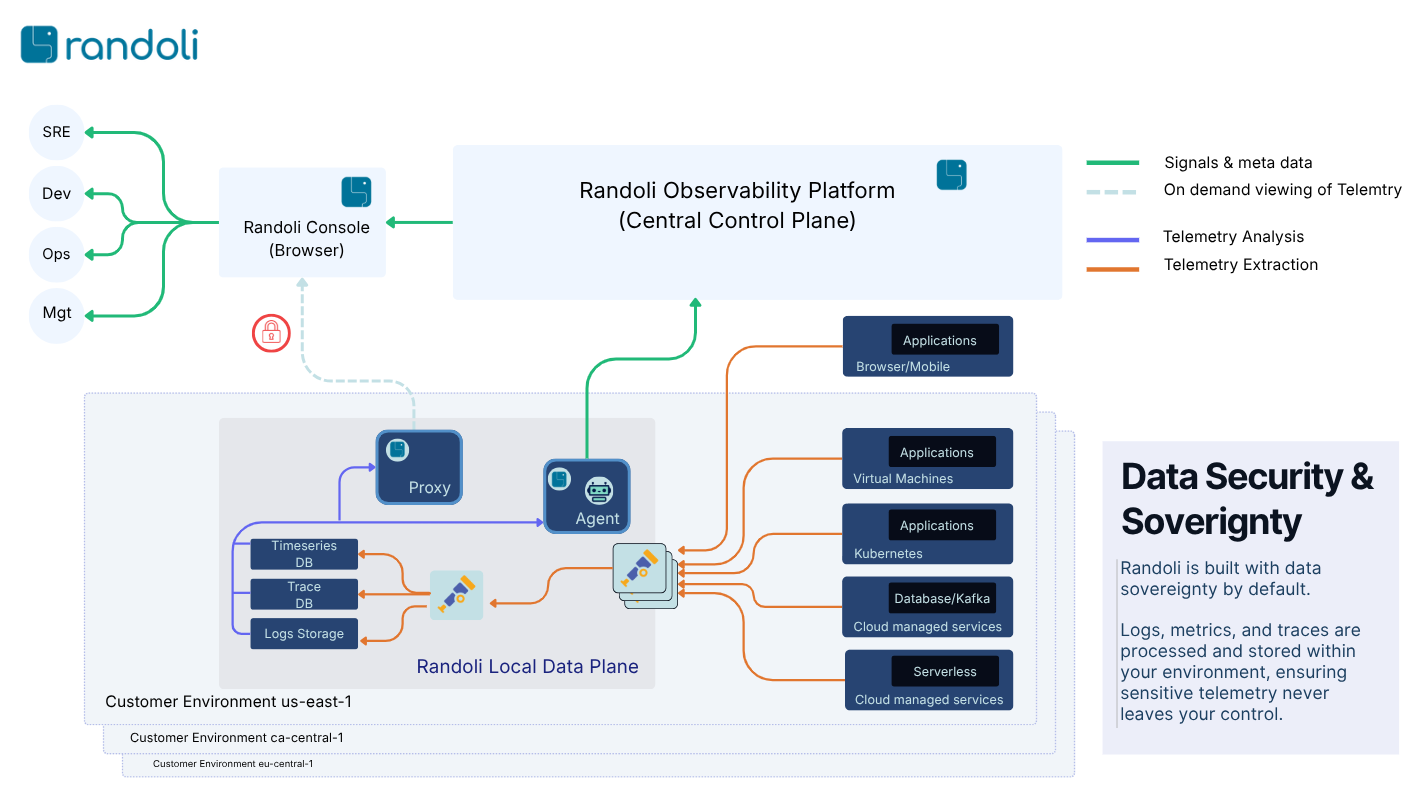
Randoli takes an innovative approach to observability with a federated control plane model. The seperation of control plane from the data plane, allows the data to be processed & stored locally & retrieved on-demand when required.
This eliminates the need to continously ingest data into our platform, resulting in signicant savings on data ingestion costs typically associated with other vendor platforms
The intelligent agent within the local control plane processes data locally to deliver real-time insights and monitoring, enabling SRE and Engineering teams to troubleshoot production incidents more effectively.
Randoli platform analyzes logs & traces locally preserving data security & sovereignty.
By leveraging OpenTelemetry as the foundation and federated control planes, Randoli you customers to control how they capture, store & retain telemetry data on their own terms.
Key Solutions
Randoli provides a unified platform that enables platform teams, SREs, and DevOps engineers to observe, analyze, and optimize their environments with ease. Each capability is designed to deliver actionable insights while ensuring you maintain complete control over your telemetry data.
Explore the solutions below to understand how Randoli supports observability, performance monitoring, cost efficiency, and incident response, all within a single integrated platform.
Infrastructure Monitoring
Get real-time visibility across your infrastructure, while cutting ingestion costs, reducing alert noise, and resolving issues faster – all under a single pane of glass.
Application Performance Monitoring
Monitor your applications with real-time performance data, cost-effective on-demand telemetry, and proactive monitoring with contextual alerts, powered by OpenTelemetry.
Log Management & Analysis
Learn about integrated logging and how to automatically detect recurring issues directly from your application logs, with no data ever leaving your environment.
Alerting & Monitors
Stay on top of issues with intelligent alerts and streamlined incident workflows, reducing response times.
Incident Management
Detect and resolve critical production issues faster with automatic issue detection, full-context telemetry, and guided resolution, purpose-built for distributed environments.
Kubernetes Cost Management
Reduce cloud waste and improve workload efficiency with data-driven cost optimization built for Kubernetes.
Why Teams Choose Randoli
Modern engineering teams today need more than just another observability tool. They need a solution that adapts to their environment, that scales with their systems, and puts them in control of their data.
Randoli is designed with these principles at its core, helping platform teams, SREs, and developers achieve:
Full Data Ownership
Your telemetry data stays within your environment, giving you complete control over storage, retention, and access.
OpenTelemetry-Native Foundation
Built on open standards to avoid vendor lock-in and integrate seamlessly with existing tools and workflows.
Federated Control Plane
Combines the simplicity of a managed experience with the flexibility of operating in your own environment.
Cost-Efficient Observability
Optimize performance and reduce unnecessary spend without compromising on data quality or insights.
Unified Platform Experience
From infrastructure monitoring to application performance, logs, and cost insights, manage everything in one place.
Get Started
Randoli brings your infrastructure, applications, and costs together in one unified platform, giving you complete visibility and control without adding operational complexity.
Ready to start? Head over to Get Started and begin setting up Randoli in your environment.